|
Case Studies
On this page you will find
examples of a range of ecological and marine biological studies where GIS has
formed an integral part of the research. They are divided into two sections.
The
first section contains case studies that are based on a variety of projects
that Dr. Colin MacLeod of
GIS In Ecology has been involved in over the last decade and demonstrates a few of the
many areas of ecological research that can benefit from the use of GIS. They
range from producing simple maps of species distribution to complex habitat
modelling and predicting the effects of climate change on species distribution.
The PDFs for these case studies are hosted on this website.
The
second section contains case studies taken from
the wider literature which have been chosen to represent as wide a range as
possible of examples of things that GIS can be used for in ecological research.
While links are provided to the articles on which they are based, these articles
are not hosted on this website and we cannot provide copies of them if these
links do not work, or if you do not have access to the sites which host the
articles.
Case Studies From Projects That Dr. Colin D.
MacLeod of GIS In Ecology Has Been Involved In:
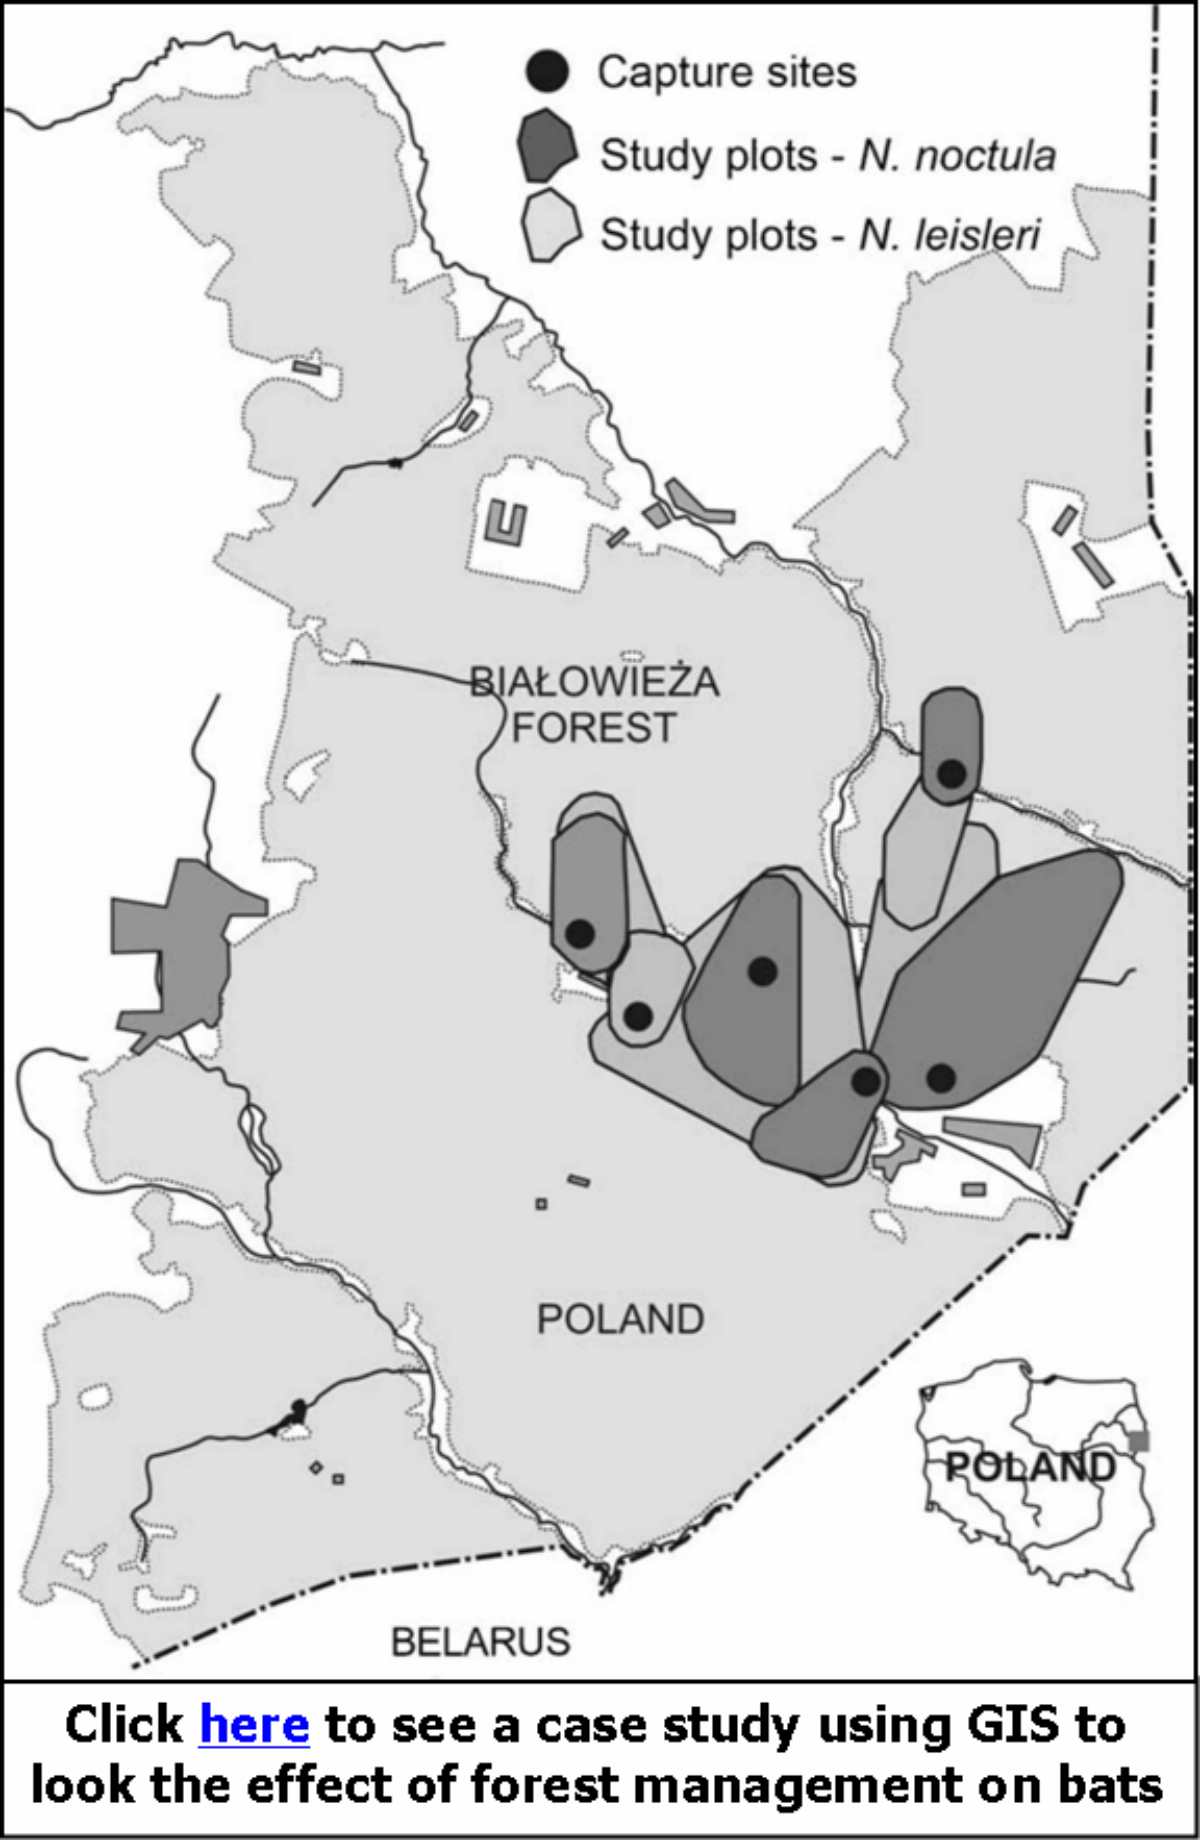 Investigating the effects of
forest management on bats in Poland: Forest management often involves the
removal of old, diseased or dying trees which are used by bats for roosting.
This project used GIS to assess whether bats use forest areas differently
depending on whether they were left untouched or whether they are actively
managed. GIS was used to assess the habitat around each bat roost and compare it
to a random sample of habitats from the same general areas to see if bats were
preferentially selecting roosting sites with specific habitat criteria and
whether this differed between the managed and primordial forest areas. Click
here to download a PDF of the finished paper. Investigating the effects of
forest management on bats in Poland: Forest management often involves the
removal of old, diseased or dying trees which are used by bats for roosting.
This project used GIS to assess whether bats use forest areas differently
depending on whether they were left untouched or whether they are actively
managed. GIS was used to assess the habitat around each bat roost and compare it
to a random sample of habitats from the same general areas to see if bats were
preferentially selecting roosting sites with specific habitat criteria and
whether this differed between the managed and primordial forest areas. Click
here to download a PDF of the finished paper.
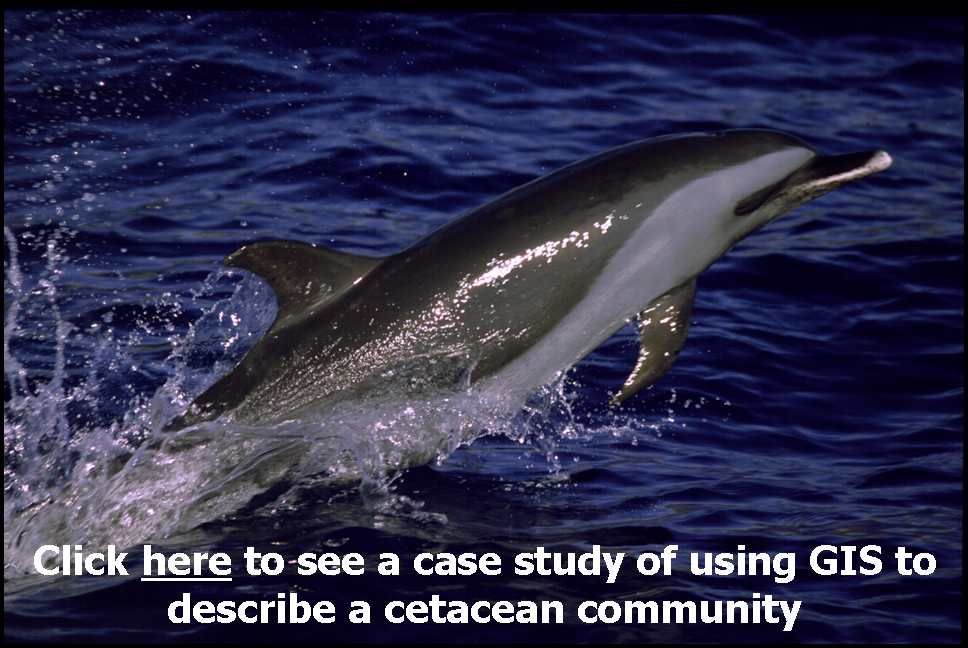 Investigating the cetacean
community around the island of St. Helena: This project used GIS to map the
occurrence of cetacean species around the island of St. Helena in the eastern
tropical Atlantic to help provide information for local conservation and
management. While this did not involve any complex GIS analysis, it is typical
of the type of project than many people initially want to use GIS for. That is,
to plot their data and create maps for use in publications, reports and
presentations. Click
here to download a PDF of the finished paper. Investigating the cetacean
community around the island of St. Helena: This project used GIS to map the
occurrence of cetacean species around the island of St. Helena in the eastern
tropical Atlantic to help provide information for local conservation and
management. While this did not involve any complex GIS analysis, it is typical
of the type of project than many people initially want to use GIS for. That is,
to plot their data and create maps for use in publications, reports and
presentations. Click
here to download a PDF of the finished paper.
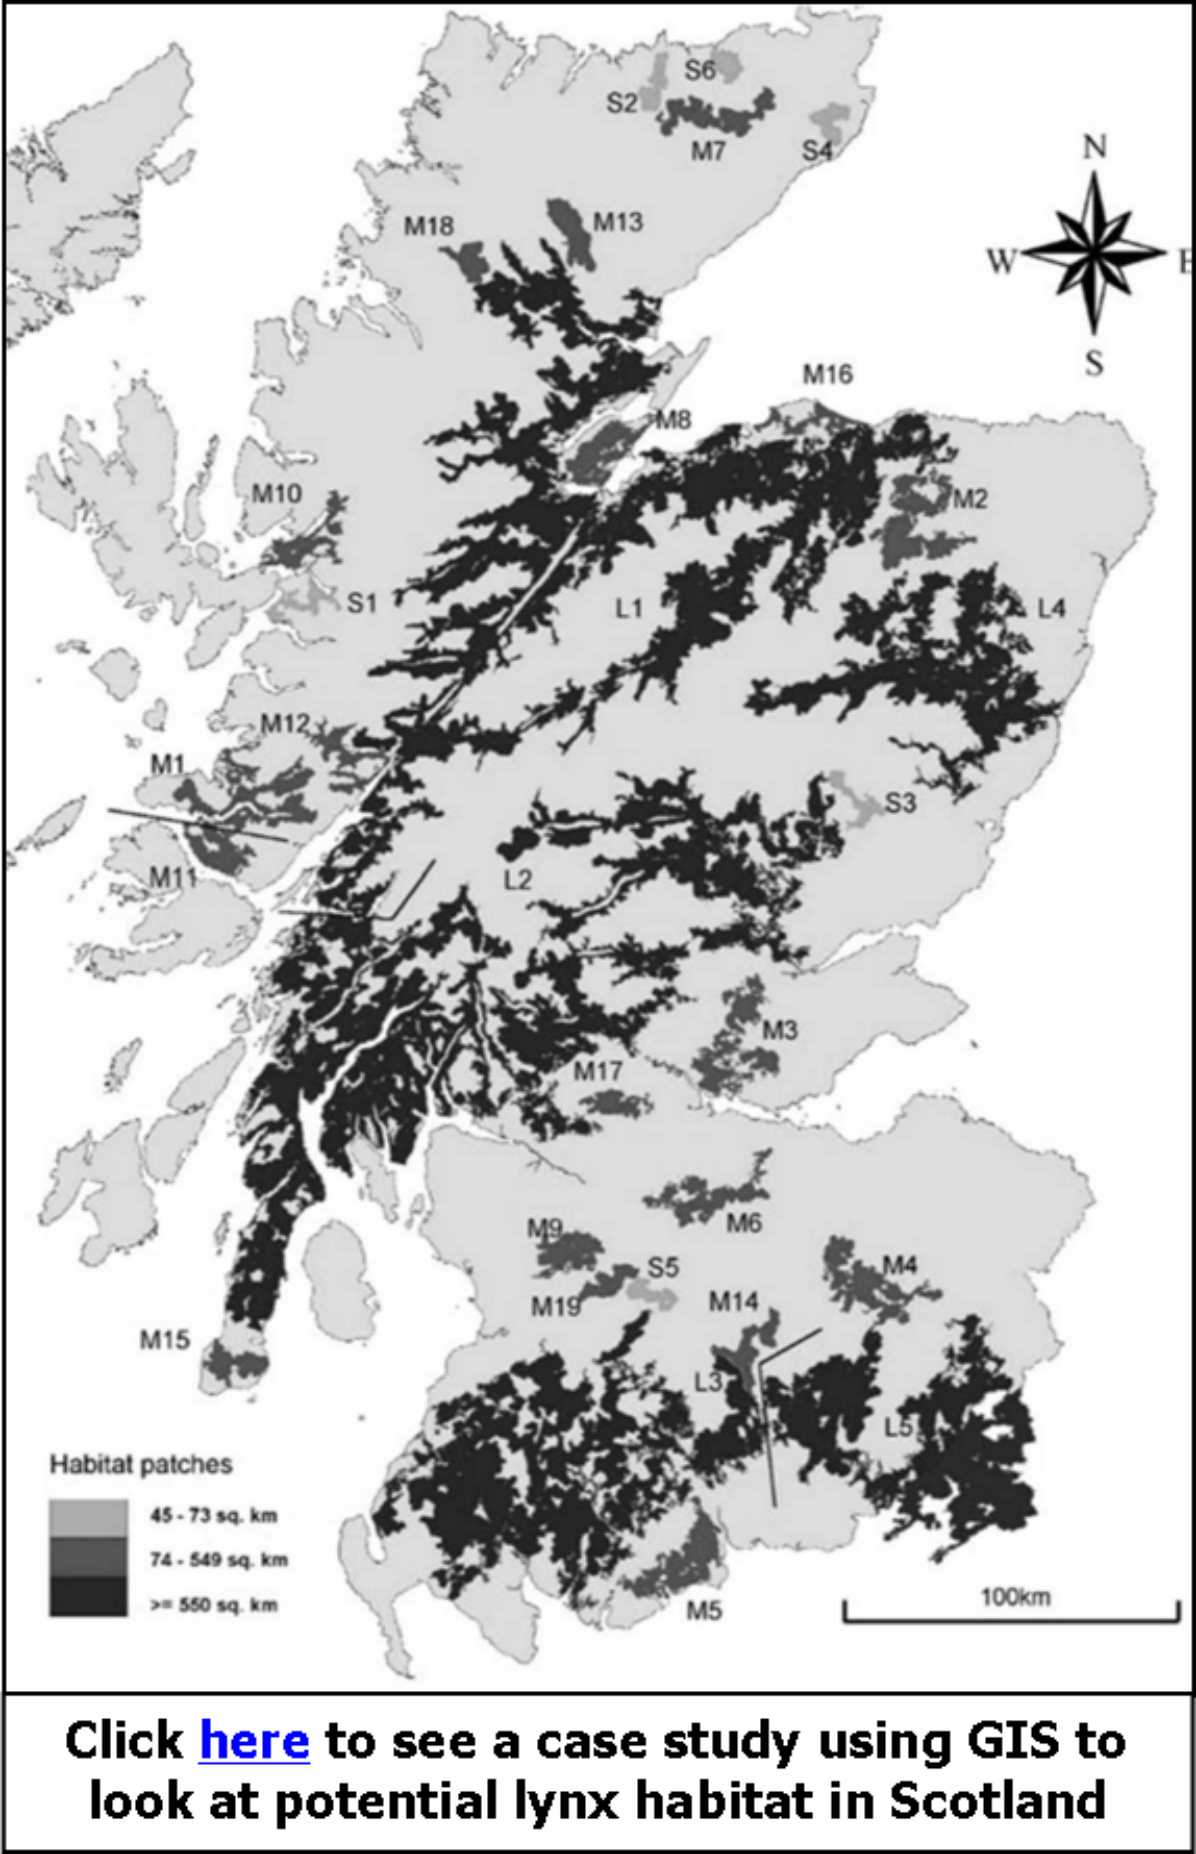 Assessing the
connectivity between potential habitat patches for Lynx in Scotland: The
lynx has been extinct in Scotland for hundreds of years. However, it is a
potential candidate for re-introduction. This project used GIS to assess the
level of connectivity between potential habitat patches for lynx in Scotland,
and therefore to assess whether Scotland could support a viable population of
lynx if they were to be re-introduced. Click
here to download a PDF of the finished paper. Assessing the
connectivity between potential habitat patches for Lynx in Scotland: The
lynx has been extinct in Scotland for hundreds of years. However, it is a
potential candidate for re-introduction. This project used GIS to assess the
level of connectivity between potential habitat patches for lynx in Scotland,
and therefore to assess whether Scotland could support a viable population of
lynx if they were to be re-introduced. Click
here to download a PDF of the finished paper.
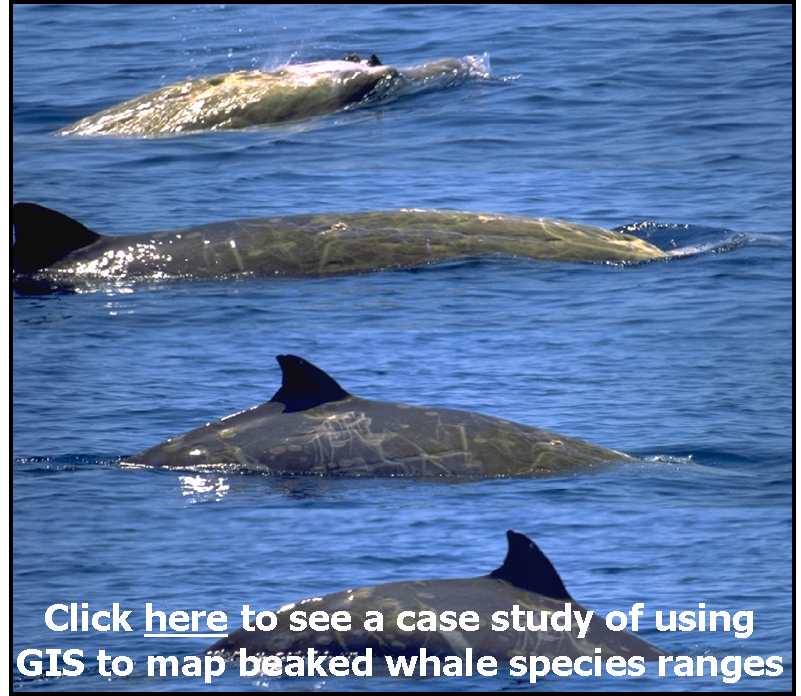 Investigating the global
distribution of beaked whales (family Ziphiidae): The beaked whales are the
least well known family of large mammals, and in 2006 as part of an
international team, I helped provide the most up-to-date understanding of the
distributions of each of the 21 currently-recognised species. This project used
GIS to plot the individual records of each species and then create maps of both
the known and inferred distributions which could be included in the final
manuscript. Click
here to download a PDF of the finished paper. Investigating the global
distribution of beaked whales (family Ziphiidae): The beaked whales are the
least well known family of large mammals, and in 2006 as part of an
international team, I helped provide the most up-to-date understanding of the
distributions of each of the 21 currently-recognised species. This project used
GIS to plot the individual records of each species and then create maps of both
the known and inferred distributions which could be included in the final
manuscript. Click
here to download a PDF of the finished paper.
Comparing the
predictive ability of different habitat modelling techniques: This project
used GIS to create and process data which would be used in a variety of
different habitat modelling techniques. The results of these models were then
imported back into the GIS and the predicted distributions compared. This
allowed us to test whether different habitat modelling techniques would result
in similar predicted distributions for a specific data set. Click
here to download a PDF of the finished paper.
Assessing the
representativeness of survey data for use in habitat analyses: When using
data for habitat analyses and modelling, it is essential to know whether these
data are representative of all available habitat combinations within your study
area. This project used GIS to develop a Habitat Representativeness Score (HRS),
which allows the objective assessment of this for any planned or past surveys.
Click
here to download a PDF of the finished paper.
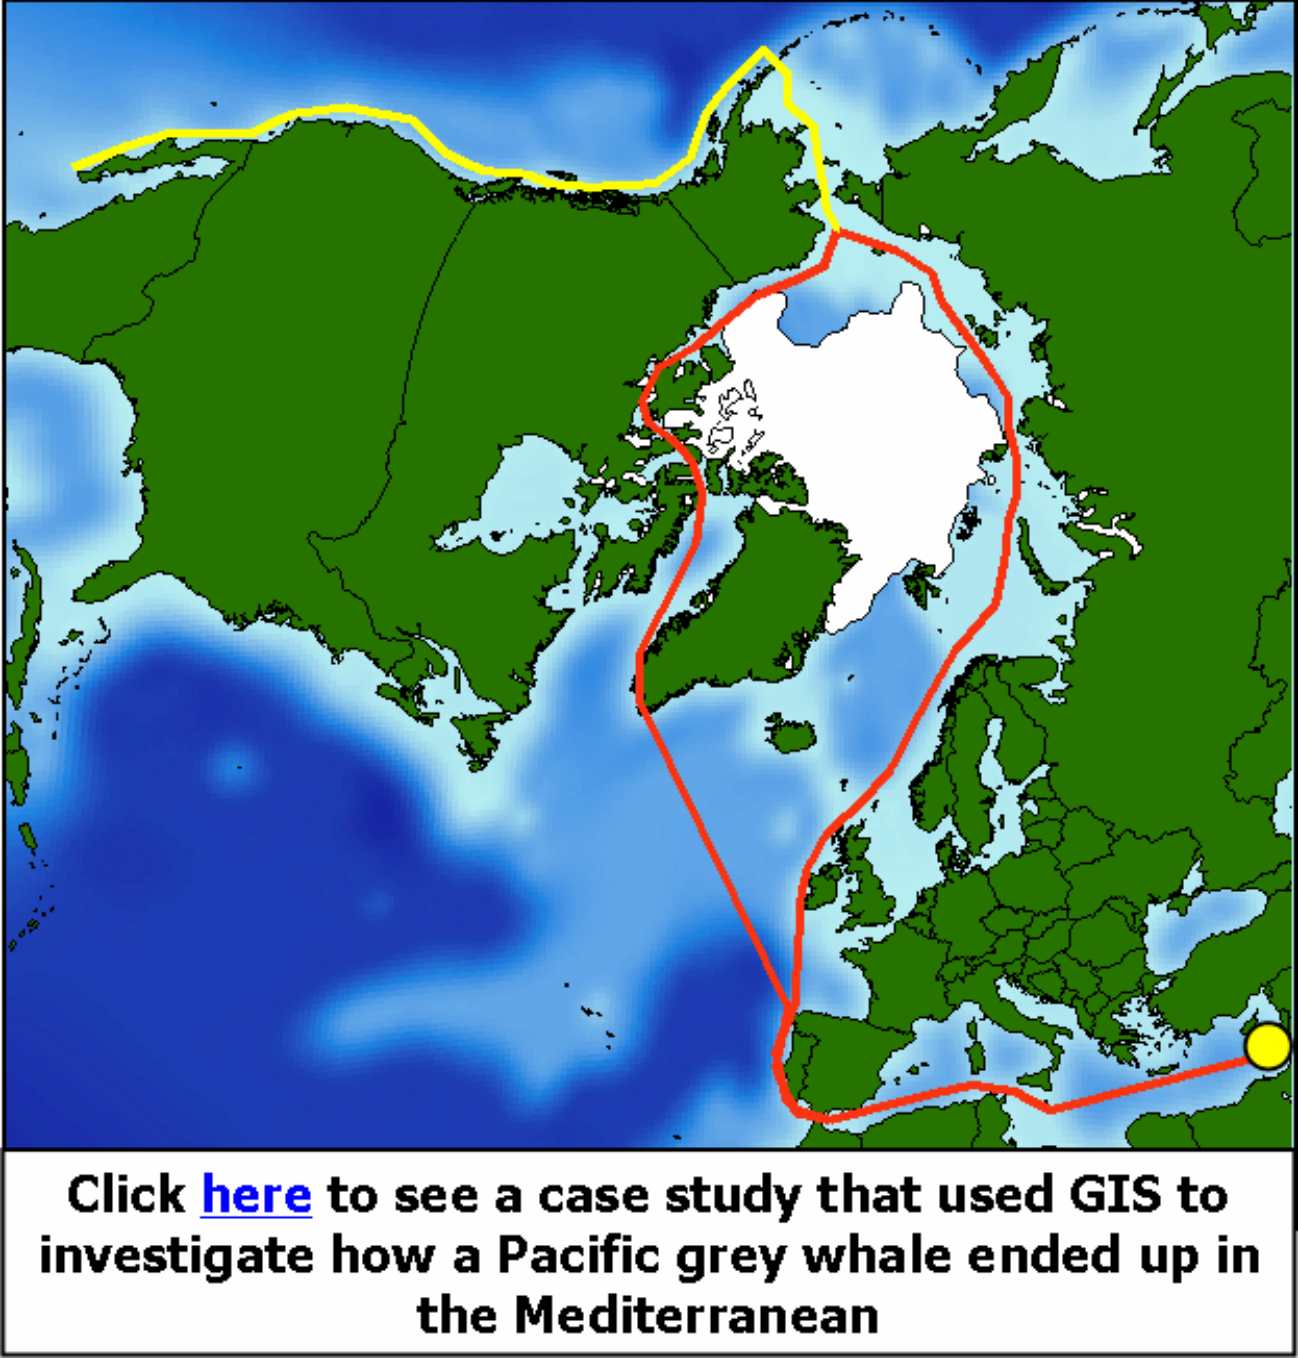 Investigating how and why a
North Pacific grey whale ended up in the Mediterranean: This project used
GIS to work out possible routes which this animal could have taken through
ice-free passages in the Arctic Ocean (resulting for warming of the oceans due
to climate change) to get from its usual feeding and breeding areas in the North
Pacific to where it was seen in the Mediterranean. It also used GIS to work out
the distances, times of passage and swimming speeds required to make this
journey. Click
here
to download a PDF of the finished paper. Investigating how and why a
North Pacific grey whale ended up in the Mediterranean: This project used
GIS to work out possible routes which this animal could have taken through
ice-free passages in the Arctic Ocean (resulting for warming of the oceans due
to climate change) to get from its usual feeding and breeding areas in the North
Pacific to where it was seen in the Mediterranean. It also used GIS to work out
the distances, times of passage and swimming speeds required to make this
journey. Click
here
to download a PDF of the finished paper.
Investigating temporal and
spatial patterns of beaked whale strandings around UK and Ireland: This
project used GIS to map the locations of strandings of beaked whales around the
UK and Ireland over the last century, or so, and then used it to divide the data
into regional and temporal groupings. This allowed us to identify spatial and
temporal patterns in the distributions of each species, and allowed us to
hypothesise that there is spatial and temporal segregation between some species
in these waters but not others. Click
here to download a PDF of the finished paper.
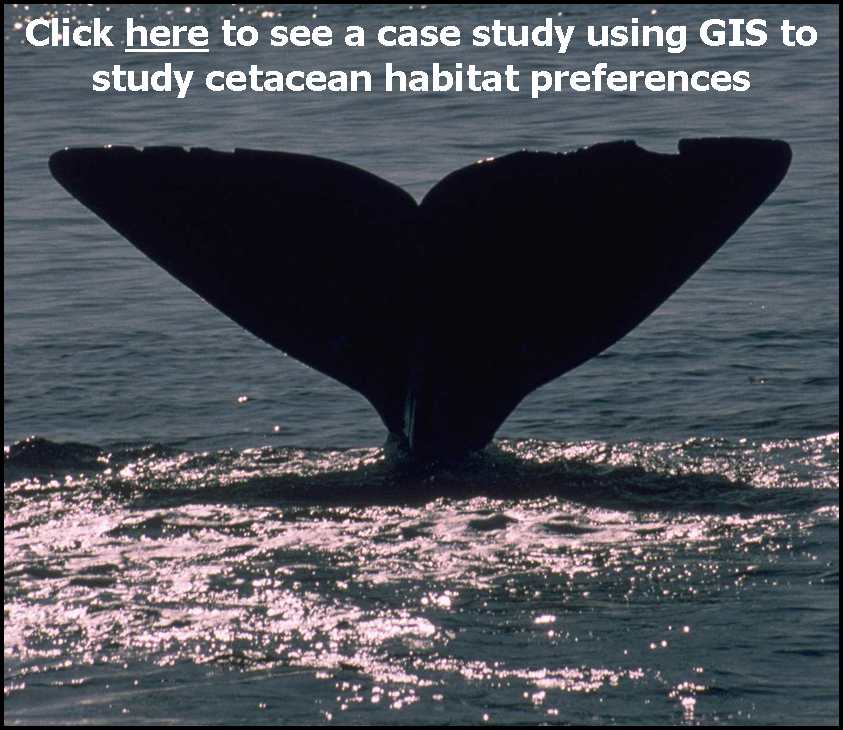 Investigating habitat
preferences of cetacean species: This project used GIS to link the
distribution of marine mammals in western Scotland to environmental variables,
such as seabed topography and water temperature. These data were then analysed
to investigate and compare the habitat preferences of different species. Click
here to download a PDF of the finished paper. Investigating habitat
preferences of cetacean species: This project used GIS to link the
distribution of marine mammals in western Scotland to environmental variables,
such as seabed topography and water temperature. These data were then analysed
to investigate and compare the habitat preferences of different species. Click
here to download a PDF of the finished paper.
Investigating
abundance-occupancy relationships in cetaceans: Abundance-occupancy
relationships are one of the most widespread relationships in ecology. This
project used GIS to calculate the abundance and occupancy of four species of
cetaceans in western Scotland. These values could then be compared to assess
whether abundance-occupancy relationships also exist in cetaceans. Click
here to
download a PDF of the finished paper.
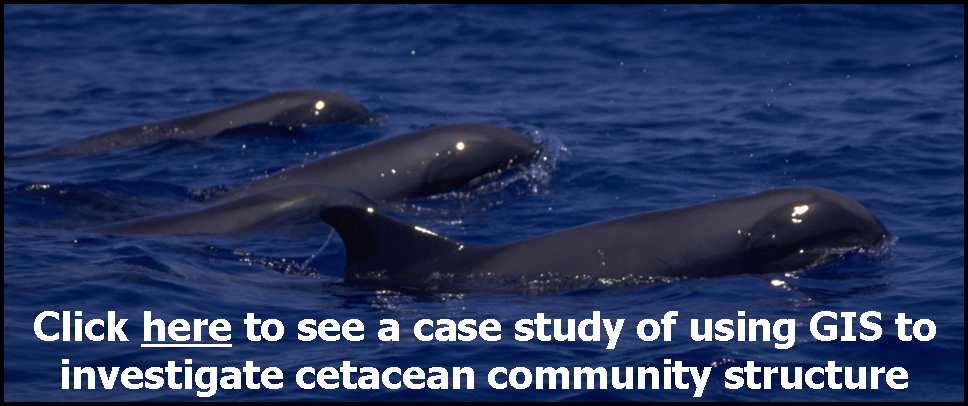 Investigating community
structure in cetaceans in the northern Bahamas: This study used GIS to help
investigate the structure and composition of a tropical cetacean community. This
was done by plotting the spatial and temporal occurrence of each cetacean
species and then comparing them in terms of the habitats they used, and their
frequency of occurrence within the study area. Click
here to download a PDF of the finished paper. Investigating community
structure in cetaceans in the northern Bahamas: This study used GIS to help
investigate the structure and composition of a tropical cetacean community. This
was done by plotting the spatial and temporal occurrence of each cetacean
species and then comparing them in terms of the habitats they used, and their
frequency of occurrence within the study area. Click
here to download a PDF of the finished paper.
 Investigating the effects of
climate change on cetacean species ranges: This is part of a long term area
of research which I have been developing since the early 2000s. It started off
as a relatively basic analysis of changes in the occurrence of cetaceans in
northwest Scotland over the last 50 years (see
MacLeod et al. 2005) as local waters have warmed, and developed into a study
investigating the effect of water temperature on the distribution and spatial
segregation of two dolphin species throughout UK and Irish waters and its
implications for climate change (see
MacLeod et al. 2006). More recently, this knowledge has been used to make
predictions about how cetacean species ranges are likely to be affected by
climate change throughout the world and what this is likely to mean for their
conservation status. This first involved a qualitative analysis (see
MacLeod 2009), and more recently has expanded to include the development of a quantitative modelling
framework to predict how climate change will affect the range of cetaceans, and
other marine organisms (see
Lambert et al. In Press). GIS has been integral both to conducting this
work, and in developing the ideas and the knowledge of how climate change
is likely to affect the ranges of marine species such as cetaceans. Investigating the effects of
climate change on cetacean species ranges: This is part of a long term area
of research which I have been developing since the early 2000s. It started off
as a relatively basic analysis of changes in the occurrence of cetaceans in
northwest Scotland over the last 50 years (see
MacLeod et al. 2005) as local waters have warmed, and developed into a study
investigating the effect of water temperature on the distribution and spatial
segregation of two dolphin species throughout UK and Irish waters and its
implications for climate change (see
MacLeod et al. 2006). More recently, this knowledge has been used to make
predictions about how cetacean species ranges are likely to be affected by
climate change throughout the world and what this is likely to mean for their
conservation status. This first involved a qualitative analysis (see
MacLeod 2009), and more recently has expanded to include the development of a quantitative modelling
framework to predict how climate change will affect the range of cetaceans, and
other marine organisms (see
Lambert et al. In Press). GIS has been integral both to conducting this
work, and in developing the ideas and the knowledge of how climate change
is likely to affect the ranges of marine species such as cetaceans.
Case Studies From The Wider Literatures (Contains Links To The External Sites On
Which The Relevant Arctles Are Hosted):
 Investigating
the movements of crabs in salt marshes: This study used GIS to look at
the spatial and temporal movements of crabs within a salt marsh and related
these movements to the quality of the habitat. This shows that GIS can be
just as useful for looking at study areas that cover relatively small areas (in
this case only 2500m2) as well as whole oceans (as was the case many
of the examples in the first section of case studies). It also shows how
GIS can be used to look at the movements of tagged animals within and between
habitats. Click
here
to read the full study. Investigating
the movements of crabs in salt marshes: This study used GIS to look at
the spatial and temporal movements of crabs within a salt marsh and related
these movements to the quality of the habitat. This shows that GIS can be
just as useful for looking at study areas that cover relatively small areas (in
this case only 2500m2) as well as whole oceans (as was the case many
of the examples in the first section of case studies). It also shows how
GIS can be used to look at the movements of tagged animals within and between
habitats. Click
here
to read the full study.
 Assessing
the abundance of parrots in The Bahamas: The Bahama parrot is notable
as containing a ground-nesting population at the northern end of its range in
the Abacos. This makes it very vulnerable to introduced predators and
other types of disturbance. This study used GIS to help plan sampling
locations during a study to estimate the abundance this species both in the
northern Bahamas and at the southern end of its range. It shows how GIS
can play an important role during survey planning, even when the actual survey
methods and analysis might not rely on GIS itself. Click
here to read the full
study. Assessing
the abundance of parrots in The Bahamas: The Bahama parrot is notable
as containing a ground-nesting population at the northern end of its range in
the Abacos. This makes it very vulnerable to introduced predators and
other types of disturbance. This study used GIS to help plan sampling
locations during a study to estimate the abundance this species both in the
northern Bahamas and at the southern end of its range. It shows how GIS
can play an important role during survey planning, even when the actual survey
methods and analysis might not rely on GIS itself. Click
here to read the full
study.
 Estimating
the species richness of insects: Estimating biodiversity is very important
in conservation, but can prove extremely difficult to do in practice, especially
for invertebrates. This study compared estimates made from an analysis of
museum specimens and from geographic-based analyses. It was in making
these geographic-based analyses that GIS was important and it was used to
estimate the range of individual species using a niche-based approach which
compared species distribution data to habitat maps, and information about the
historical dispersal limits of a specie to prevent over-fitting of the resulting
predicted distribution. This shows how GIS can be used to look at studies
involving multiple species to produce composite indices of biodiversity, such as
species richness. It also demonstrates that GIS can be applied to research
on small as well as large creatures. Click
here to read the full
study. Estimating
the species richness of insects: Estimating biodiversity is very important
in conservation, but can prove extremely difficult to do in practice, especially
for invertebrates. This study compared estimates made from an analysis of
museum specimens and from geographic-based analyses. It was in making
these geographic-based analyses that GIS was important and it was used to
estimate the range of individual species using a niche-based approach which
compared species distribution data to habitat maps, and information about the
historical dispersal limits of a specie to prevent over-fitting of the resulting
predicted distribution. This shows how GIS can be used to look at studies
involving multiple species to produce composite indices of biodiversity, such as
species richness. It also demonstrates that GIS can be applied to research
on small as well as large creatures. Click
here to read the full
study.
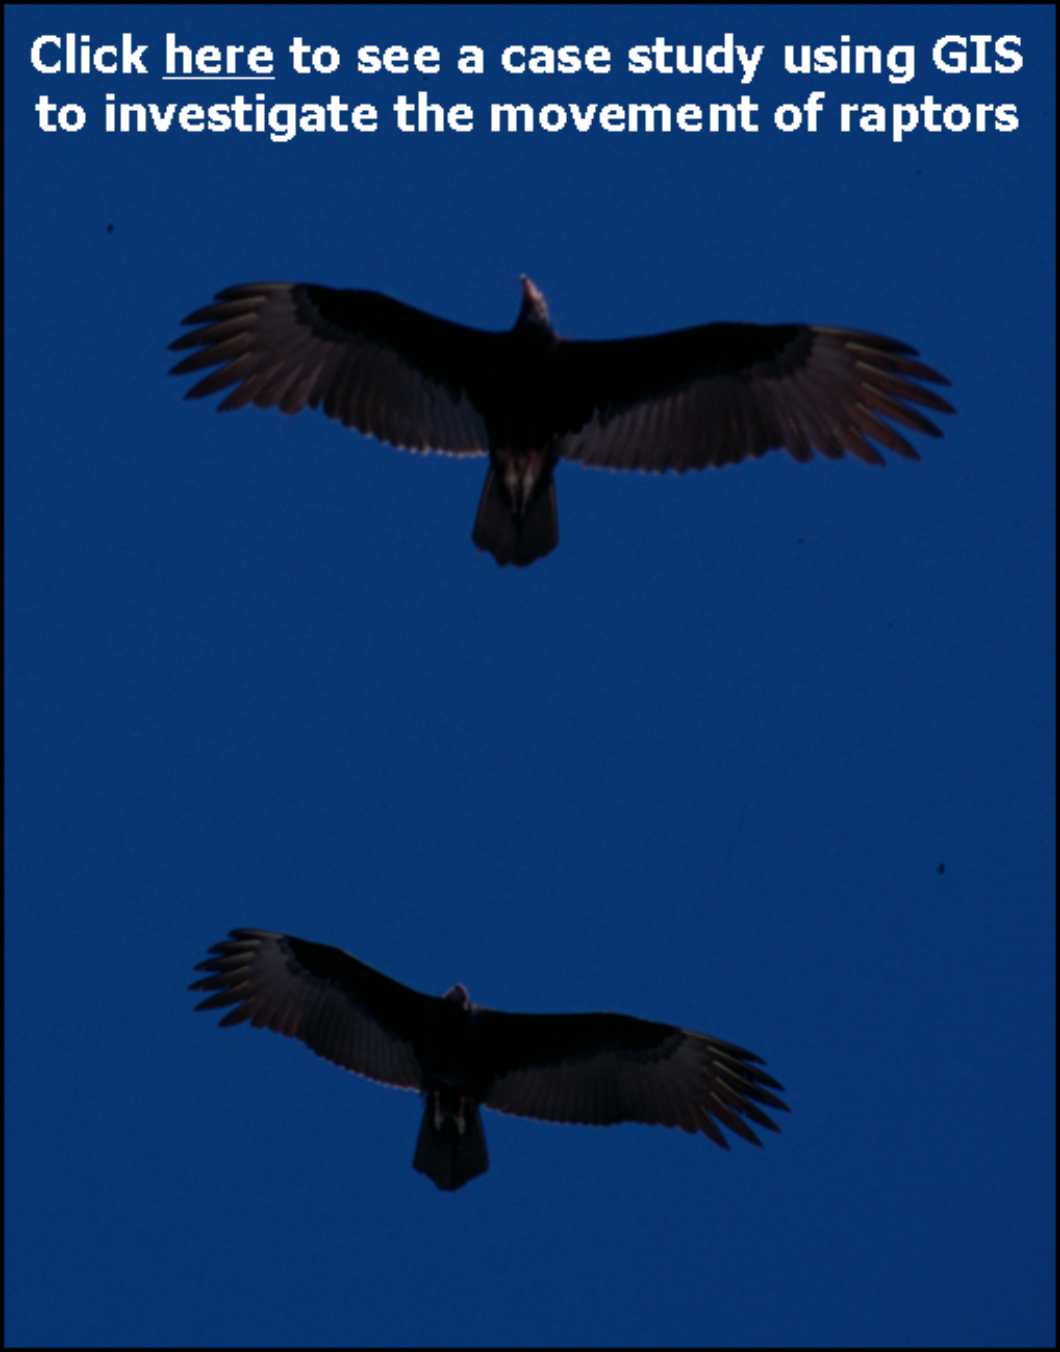 Investigating
raptor movements to help minimise the risk of bird strikes on aircraft:
Due to their large size, raptors, such as turkey vultures, can be a hazard to
fast-flying aircraft. They can also be difficult to spot from an aircraft
while it is in flight. This study used GIS to help develop a bird
avoidance model based on the seasonal movements of raptors. This study
shows how GIS can be used in applied research aimed at solving a specific
problem as well as for other areas of ecological research.
Click
here
to read the full study. Investigating
raptor movements to help minimise the risk of bird strikes on aircraft:
Due to their large size, raptors, such as turkey vultures, can be a hazard to
fast-flying aircraft. They can also be difficult to spot from an aircraft
while it is in flight. This study used GIS to help develop a bird
avoidance model based on the seasonal movements of raptors. This study
shows how GIS can be used in applied research aimed at solving a specific
problem as well as for other areas of ecological research.
Click
here
to read the full study.
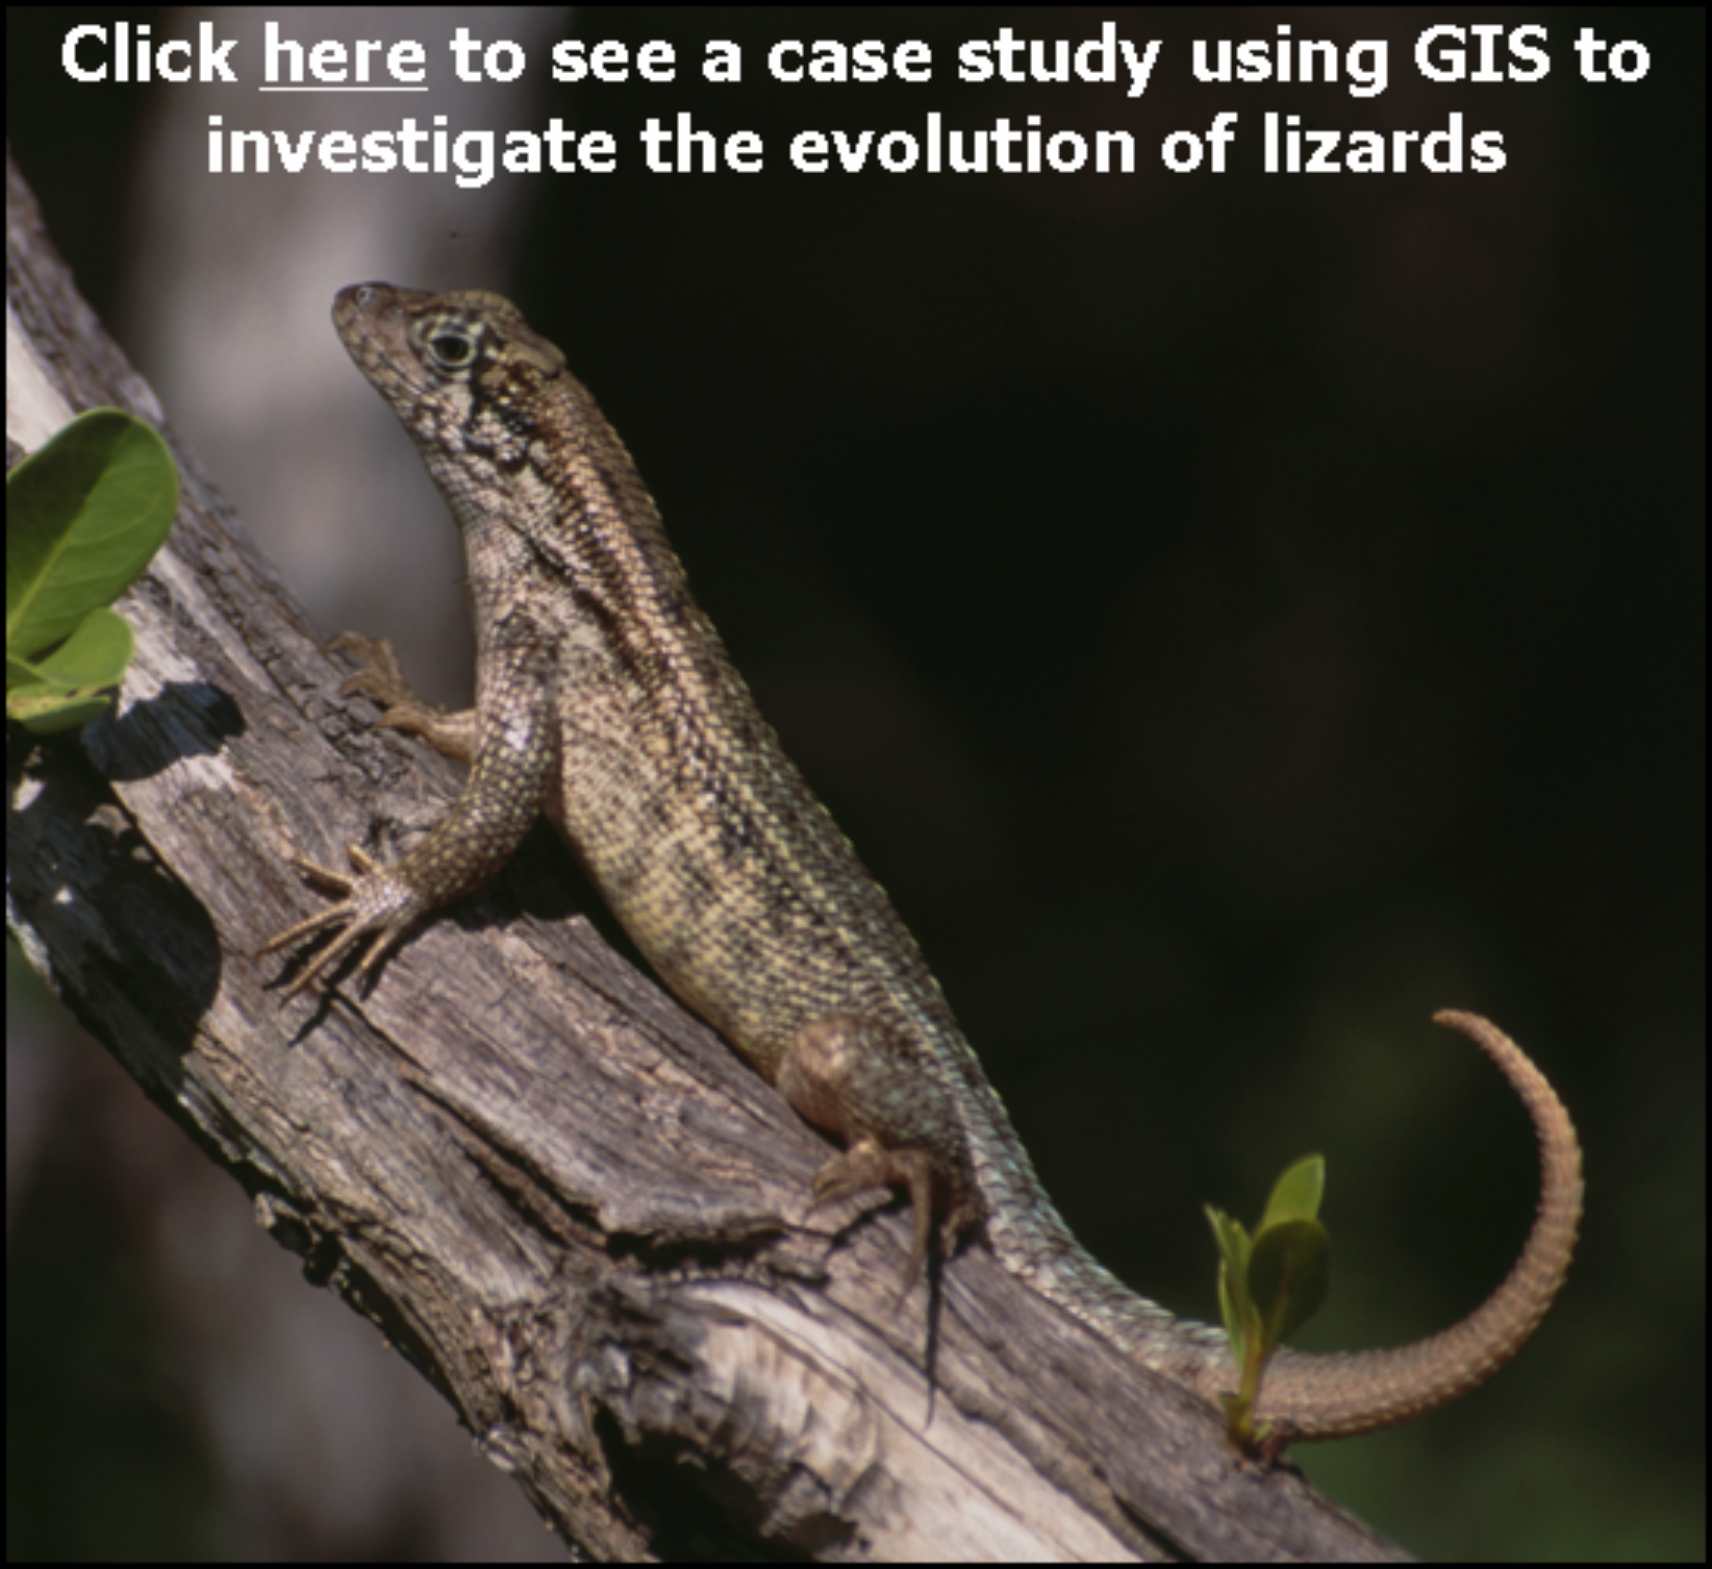 Investigating
The Evolution Of Anolis Lizards: Anolis lizards are one of the
best-studied examples for evolution in action. This study combined the
power of phylogenetic analysis with GIS to investigate how the niches occupied
by individual species is related to the evolutionary relationships, and to
assess whether more closely related species occupy more similar niches than more
distantly related species. This study shows how GIS can be combined with
other more established approaches, such as phylogenetic analysis or genetics, to
enhance the capabilities of such techniques. Thus, GIS is not
something that should be considered on it own, but as one of a suite of tools
that are available to ecologists to investigate, and hopefully answer, their
research questions.
Click
here to read the full
study. Investigating
The Evolution Of Anolis Lizards: Anolis lizards are one of the
best-studied examples for evolution in action. This study combined the
power of phylogenetic analysis with GIS to investigate how the niches occupied
by individual species is related to the evolutionary relationships, and to
assess whether more closely related species occupy more similar niches than more
distantly related species. This study shows how GIS can be combined with
other more established approaches, such as phylogenetic analysis or genetics, to
enhance the capabilities of such techniques. Thus, GIS is not
something that should be considered on it own, but as one of a suite of tools
that are available to ecologists to investigate, and hopefully answer, their
research questions.
Click
here to read the full
study.
|