This is an archived version of this site. For the new active version, please click here.
|
|
|
|
FAQs - Frequently Asked Questions
On this page you will find the answers to some Frequently Asked Questions (FAQs). Currently, these are based on our experiences with using GIS in ecological research. We will add to this webpage in due course as and when new FAQs arise These FAQs are divided into a number of sections. You can scroll down to page to find these sections, or you can click on the following links to go directly to them. For the rules for submitting an FAQ for this web site, click here. Alternatively, you can ask questions on our online forum. 1. General questions about GIS; 2. General questions about using GIS in ecological research; 3. Questions about problems with your GIS project/data layers; 4. Questions about 'GIS In Ecology' and the services we offers; 5. Other frequently asked questions.
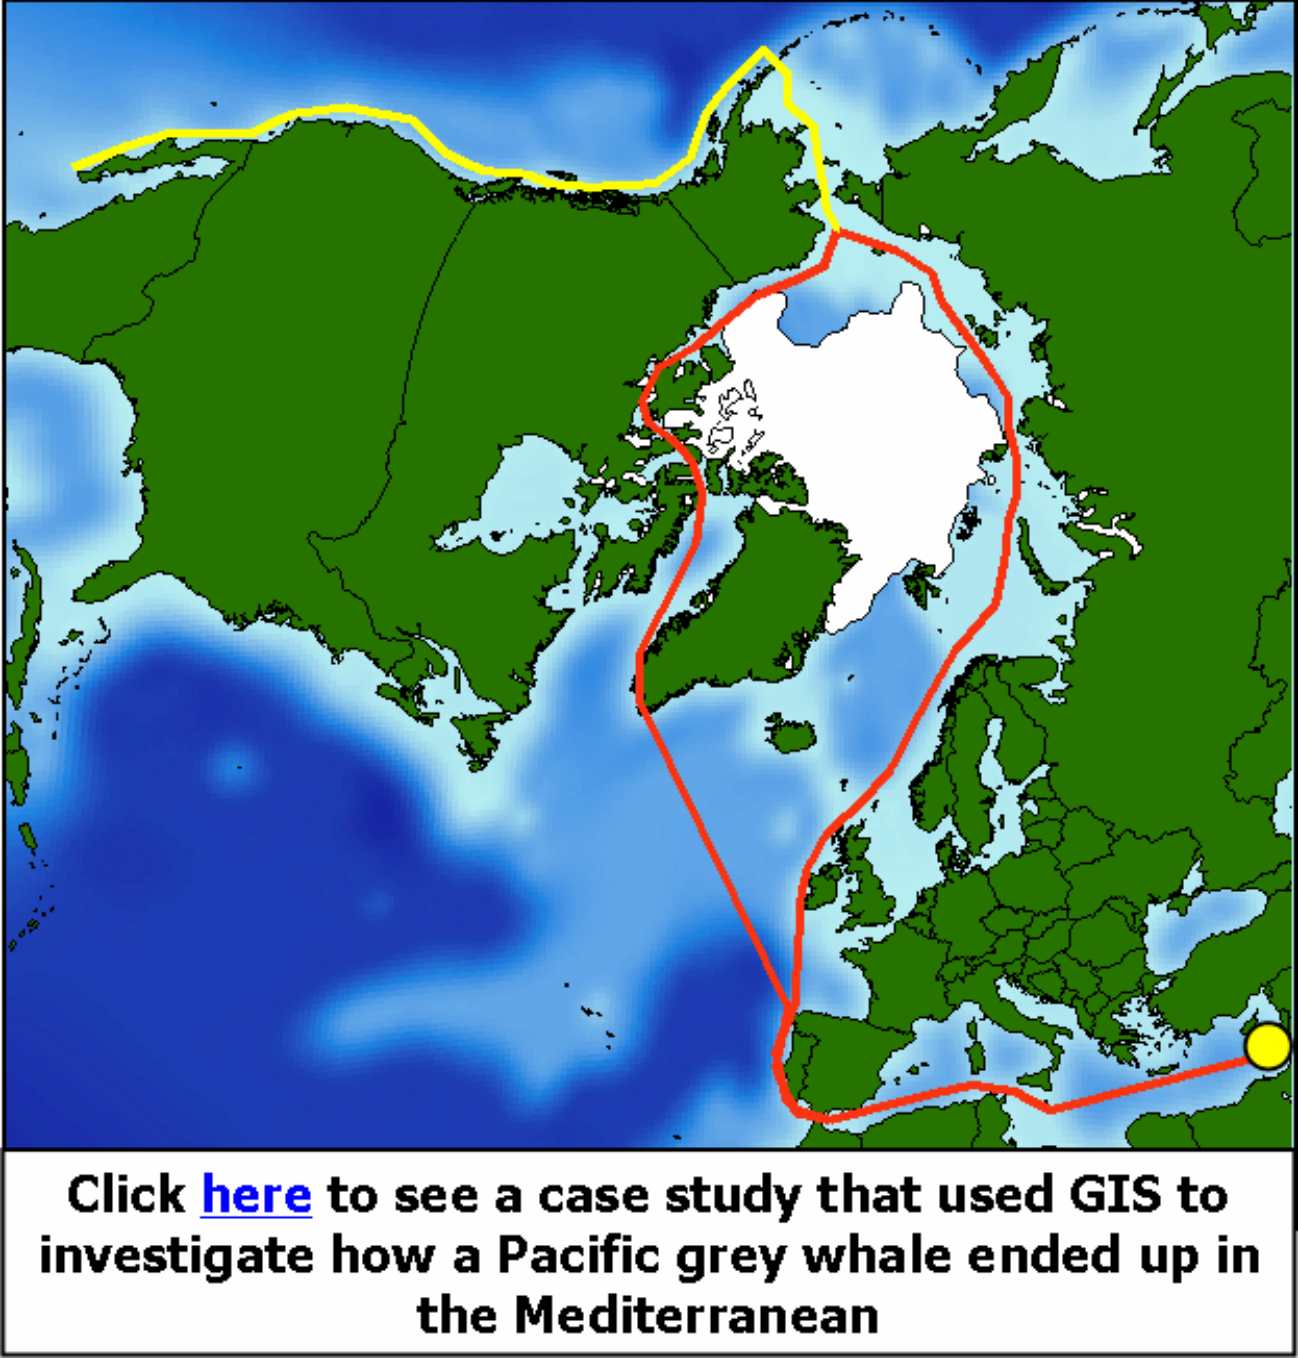
1. General Questions About GIS: What is GIS? A GIS (or Geographic Information System) is a data base which allows you to explore the spatial relationships between different data sets. You can find out more about what this means and how it can be used by clicking here. Why should I use GIS in my research? You do not have to use GIS in your research. However, the chances are that it will be greatly enhanced if you do. This is because almost all ecological data sets inherently contain a spatial component that is worth exploring. You can find out more information about why you should use GIS in your research by clicking here.
One of the best, and cheapest, ways to get started in using GIS in your research is to find someone you know who already uses GIS and get them to show you what you need to do. If this is not an option for you, you can do a training course, or read a good GIS book. When selecting a course or a book it is important that you check that it will tell you what you need to know before you pay for it. In particular, many GIS courses and books are aimed at terrestrial geographers or business users and not ecologists. As a result, you may find that it is difficult to apply the knowledge you get from such sources to ecological research. You can find out about GIS courses and training that we provide specifically for ecologists by clicking here, and you can find links to our GIS books here. We are not the only ones who provide such information, but we like to think we are the best. If you wish to check out our competition, you can find other GIS training courses and books using internet search engines and popular book selling web sites. What GIS software should I use? There is no right or wrong answer to this question, and it will depend on what resources you have to pay for software licences and what you need to do with your GIS project. You can find out about some of the GIS software packages which are available by clicking here. Where can I get data to include in my GIS project? You can either collect the data for your GIS yourself (usually using a GPS receiver), or you can use pre-existing data layers that someone else has already created. These data layers may be made by your colleagues or you may be able to get them from other sources. A list of sources of GIS data layers which might help you with your project can be found here.
2. General Questions About Using GIS In Ecological Research: What is a data layer?
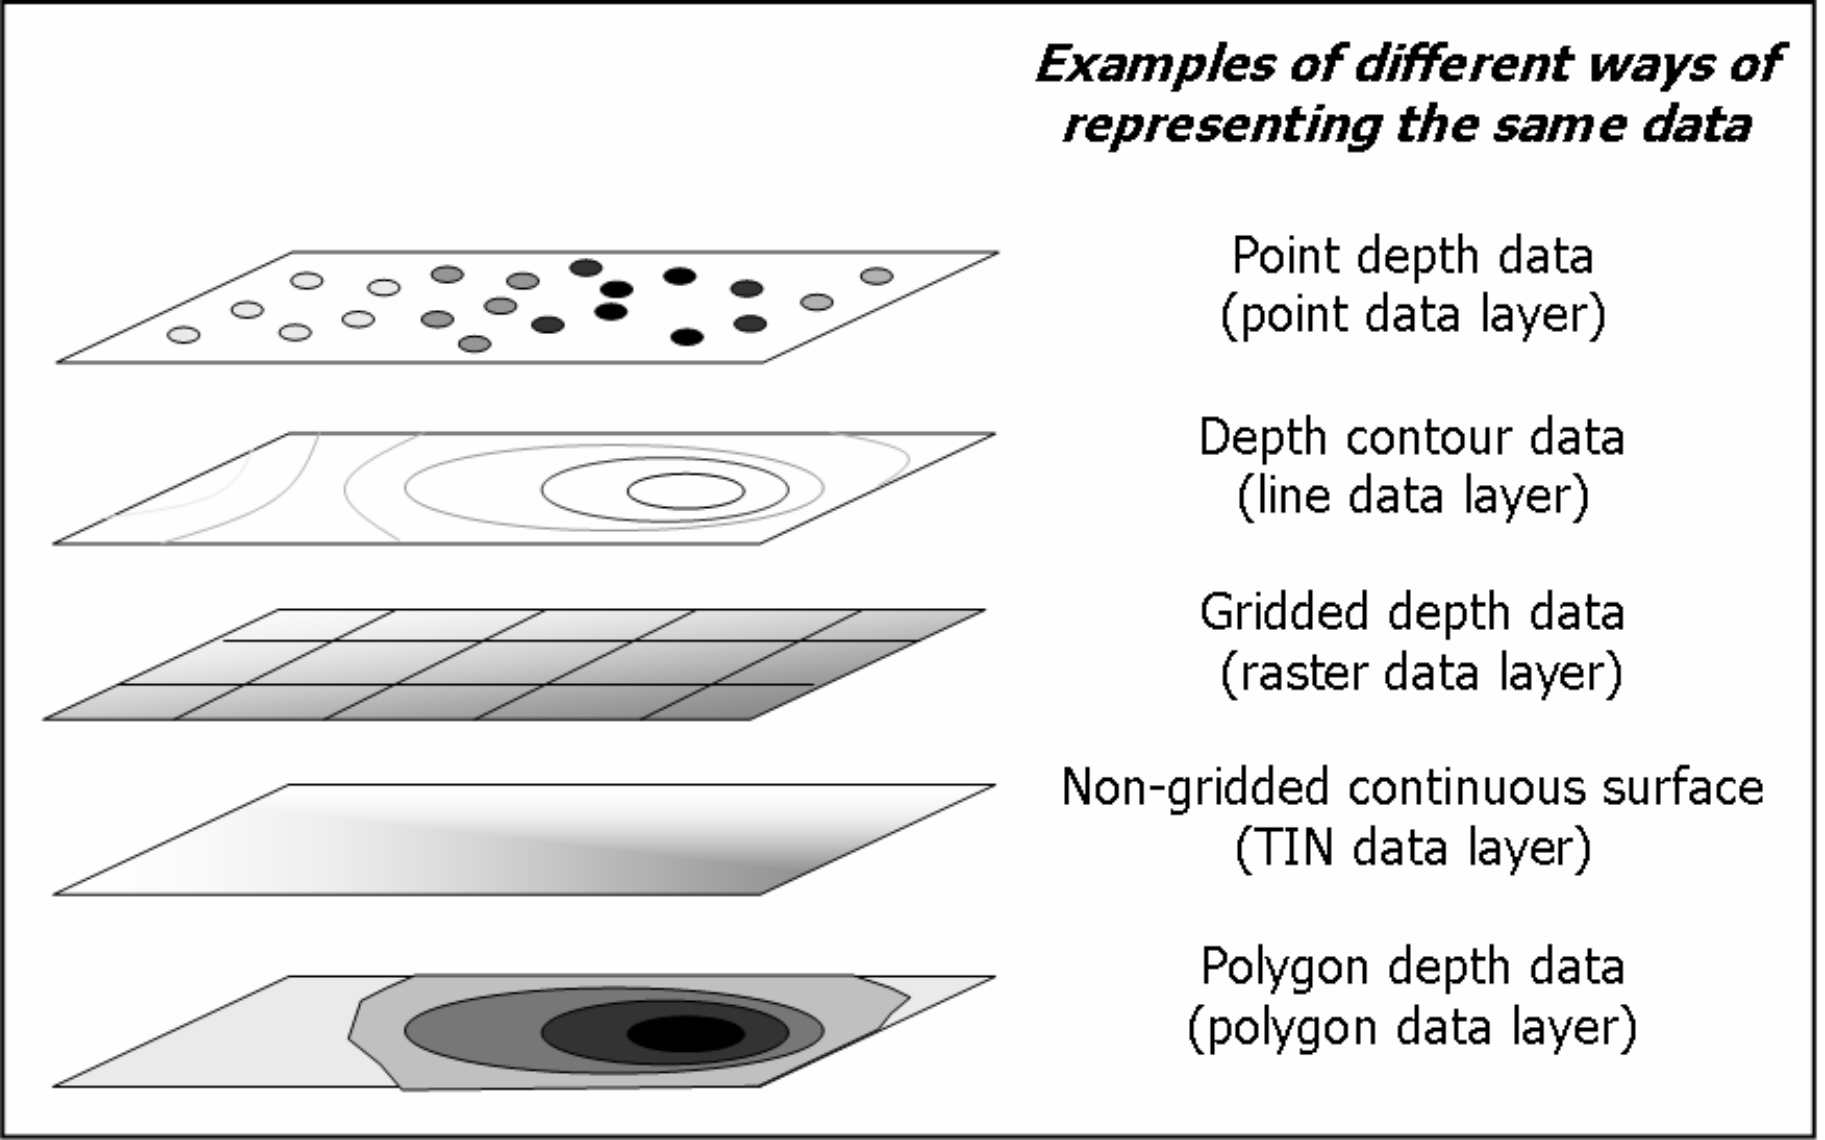
A data layer is a data set which contains a specific set of information in a specific way in a GIS project. For example, it might represent depth contours as lines, or sampling sites as points. You cannot have data in more than one format in the same data layer. For example, you cannot have depth or altitude data represented as contour lines and points in the same data layer, as you might see on a traditional nautical chart or terrestrial map. More information about the different ways data can be represented in individual data layers can be found in chapter five of An Introduction To Using GIS In Marine Biology By Colin D. MacLeod. Data layers consist of a number of different files and/or folders with the same name, but with different suffixes such as .shp and .dbf. All these separate files are needed for a data layer to be used in a GIS project. As a result, if you are copying any data layer files outside of your GIS software, always make sure that you copy all the parts of it. What is a vector or feature data layer? A vector or feature data layers are data layers which contain points, lines or polygons (known as features), each of which are defined by a set of X and Y coordinates (also know as vectors) which mark where they should be plotted in a GIS. Vector data layers are usually accompanied by an attribute table, which is essentially a list that contains information about each point, line or polygon within that specific data layer. A vector data layer cannot contain multiple types of features. For example, a vector data layer can contain either points, lines or polygons, but it cannot contain points and lines, lines and polygons, points and polygons or all three types of feature together. Since vector data layers are essentially a list of coordinates which are grouped to define individual features, they are not necessarily dependent on the projection and coordinate system in which they were created, and can easily been transformed into different projections and coordinate systems. While the relative positions of points and lines, and the shapes of polygons, may appear to change during such a transformation, they will still represent the same locations on the surface of the Earth. A vector data can represent a grid, where each grid cell is a separate polygon, with accompanying information in an attribute table. This is known as a polygon grid to separate it from a raster grid. What is a raster, raster grid or raster data layer? A raster data layer (also know as a raster grid or just a raster) is a data layer which is arranged in a grid, or an array, format. However, unlike vector data layers, each cell within this grid is not a separate feature, and raster data layers are not accompanied by an attribute table which lists the information about each individual grid cell. Instead, the data are stored as an array of rows and columns which give the value for each grid cell, along with information on the size of each grid cell (the height and the width), the number of grid cells in each row and column, and the position of the centre of one of the grid cells (usually the top left-hand grid cell). This information allows the GIS software to know where the raster data layer should be plotted. In general, each cell in a raster data layer is square, and, thus, a raster data layer is very much dependent on the projection and coordinate system which it was created in. As a result, it can be difficult to transform a raster data layer into a different projection and coordinate system. Raster data layers are also known as raster grids to separate them from polygon grids. What type of data layer should I use for my data? Data layers come in a range of different types. These include polygon data layers, line data layers, point data layers and raster data layers. Each have their own advantages and disadvantages, and will be best suited to different purposes. As a result, it is important to make sure that you use the right type of data layer for your specific data set and your specific research question. However, this also means that it is not possible for anyone other than you to decide what the best data layer type is for a given data set. The best thing to do is to read up about advantages and disadvantages of the different types of data layers and then decide which is the one for you. You can find some additional information on this in chapter five of An Introduction To Using GIS In Marine Biology By Colin D. MacLeod.
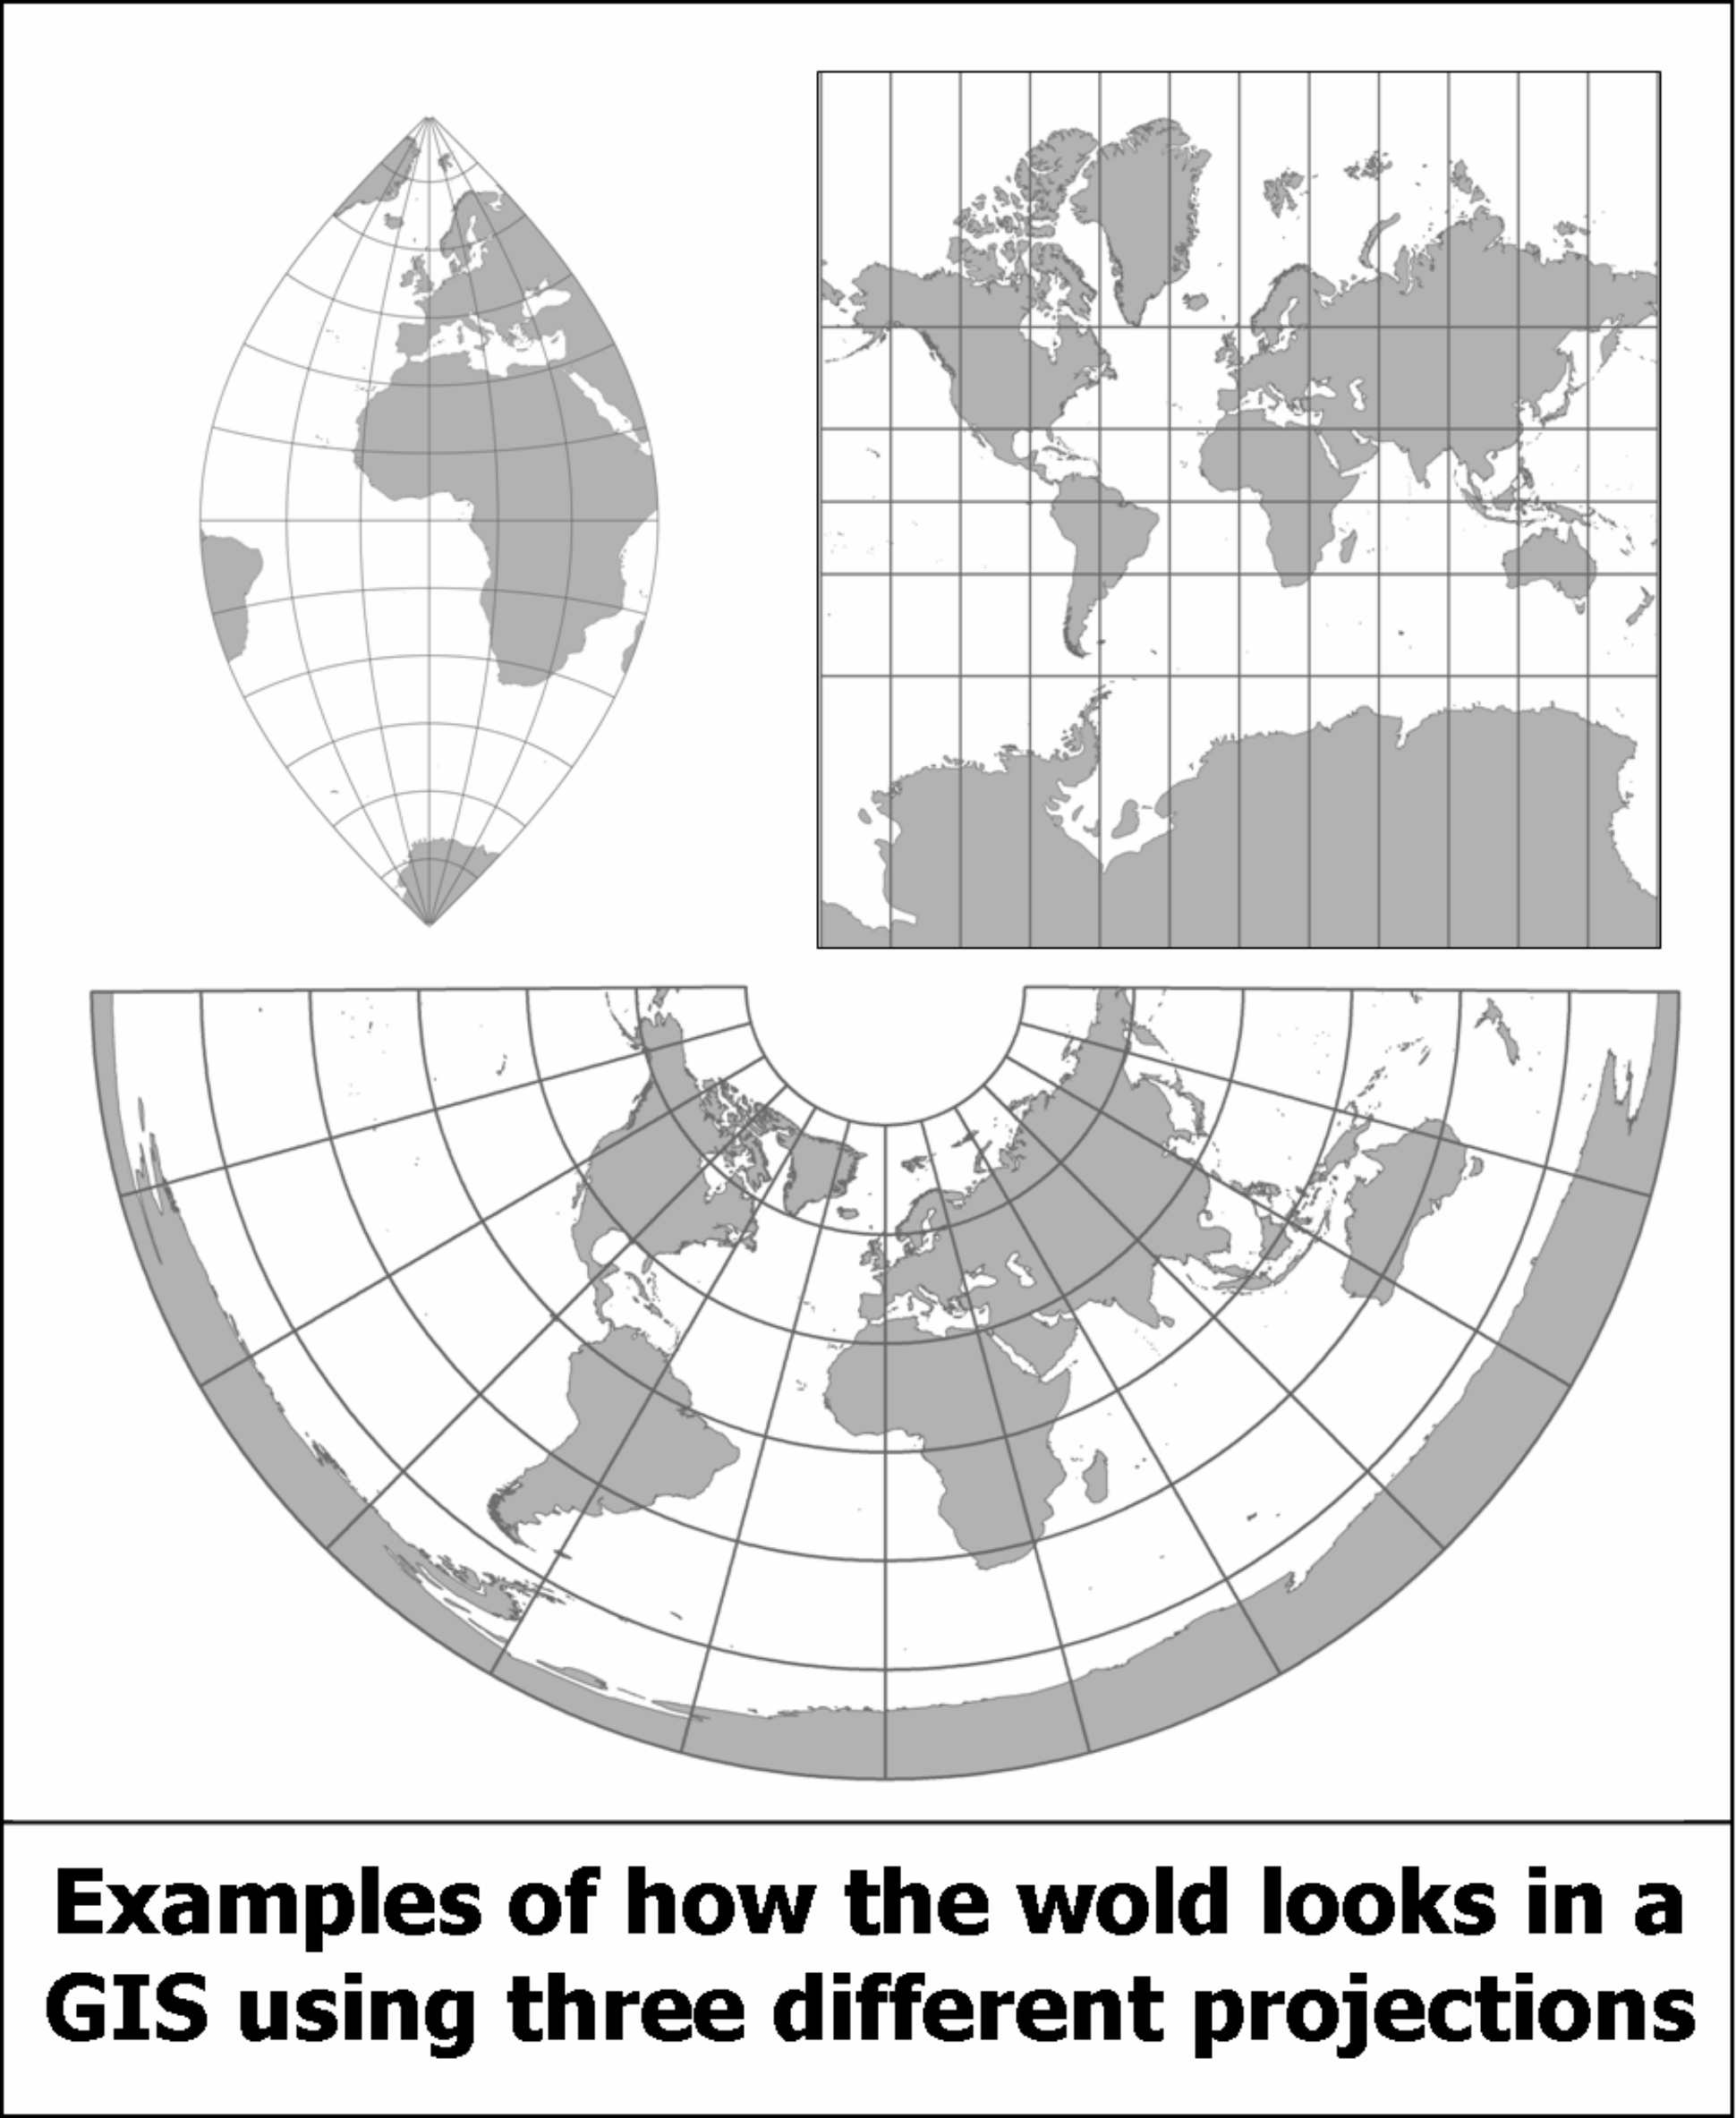
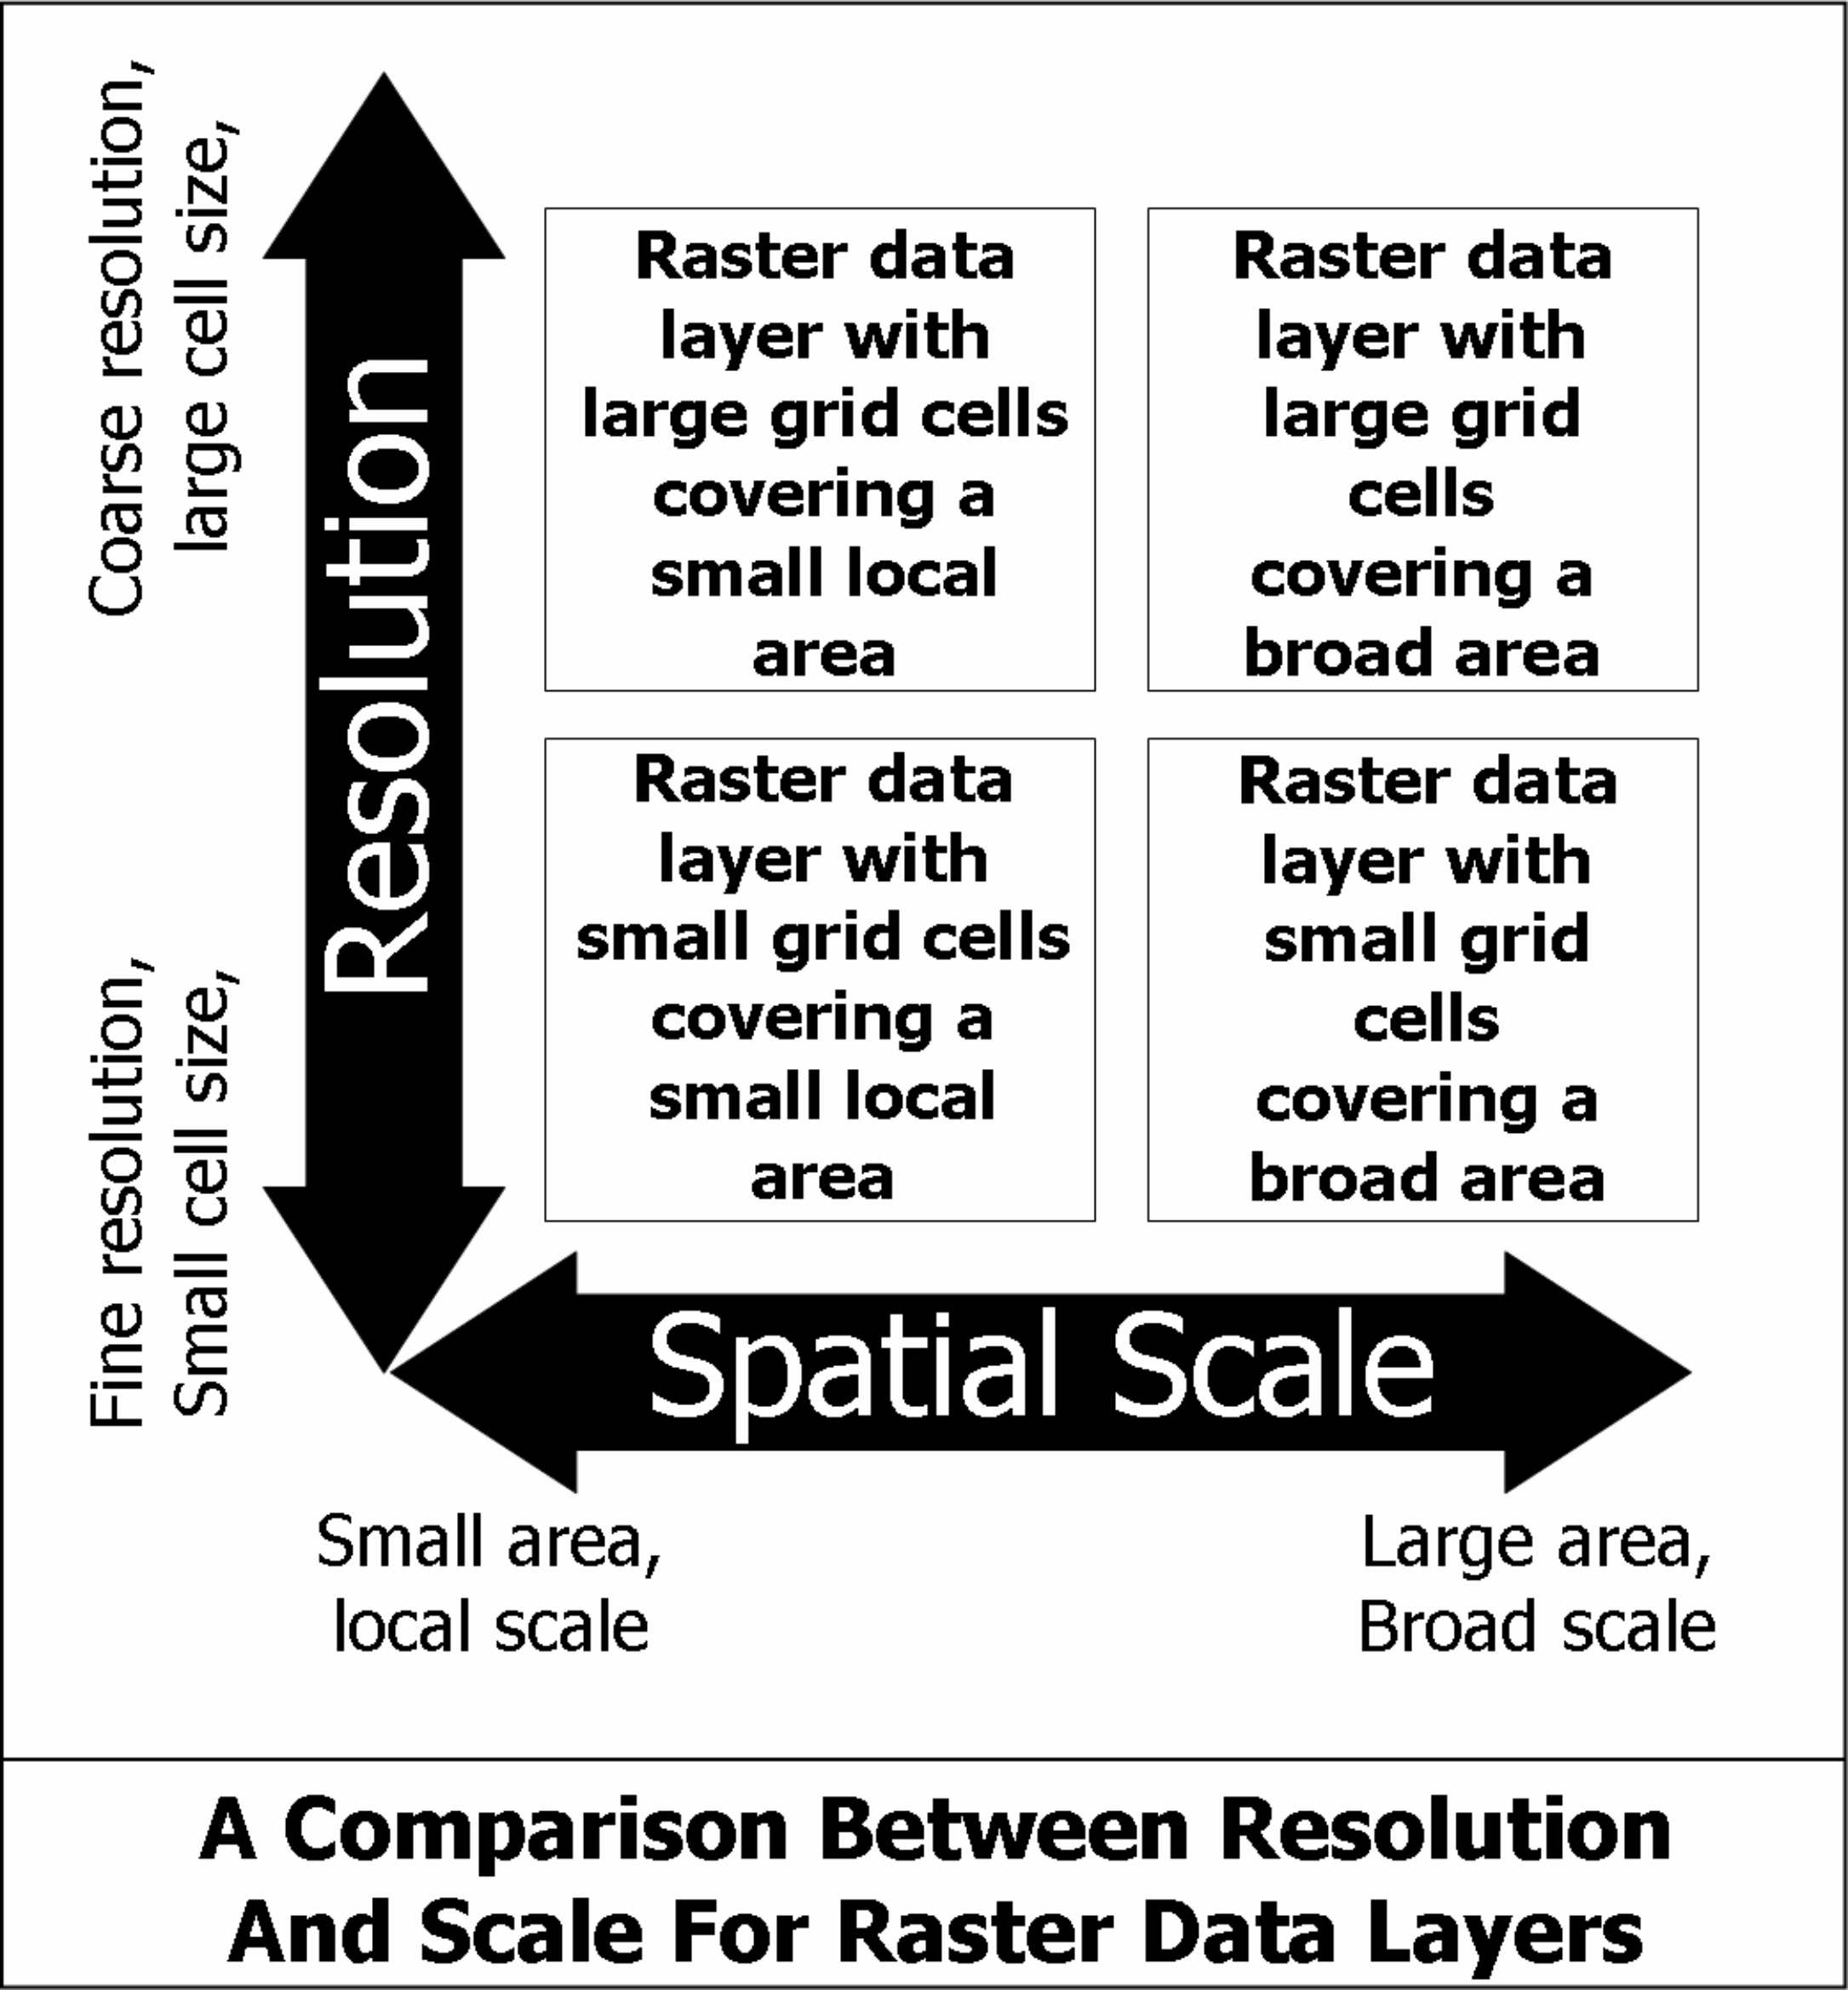
A projection is a way of displaying the surface of a three dimensional object (in this case planet Earth) on a two dimensional flat surface, such as a piece of paper (in the case of a traditional map or chart) or a computer screen (in the case of GIS software). As you might imagine, this is not a simple process and it always leads to some distortion. As a result, there are many different types of projections, each of which distorts the Earth’s surface in a different way to make it fit onto a flat surface. In general, for ecological GIS projects, the most appropriate projection is likely to be either a local, regional or nation-specific projection, such as the British National Grid projection. If one is not available, a transverse mercator (for study areas <~300km in radius) or Lambert azimuthal equal area (for study areas <~1,000km) centred on, or close to, the middle of the study area will usually suffice. However, once you move a long way away from the centre of such projections, the relationships between points start to become distorted. As a result, for larger study areas (such as whole regions or oceans), other projections may be more appropriate depending on exactly what you wish to do with your GIS project. For example, you may need a different projection to accurately measure large areas than to accurately measure long distances. In addition, different projections may be required for long (>1,000km), narrow study areas than for square ones in order to minimise the distortion along its entire length. Finally, it is worth mentioning the so called ‘geographic projection’. This is not a true projection and it uses decimal degrees as its unit of measurement. This means that it can be used to plot the entire globe. However, a decimal degree does not represent the same distance in all parts of the world. For example, a decimal degree of latitude is shorter in real terms at the equator than at the poles due to the curvature of the Earth. In addition, a decimal degree of longitude does not necessarily equal a decimal degree in latitude in terms of real distances. As a result, the geographic projection should not be used for measuring distances or doing calculations based on distances (such as calculating the slope of the seabed). Projections are one of the most important things to understand in GIS and using the wrong projection or trying to compare data which use different projections without taking this into account are some of the most common mistakes made when using GIS. What is a coordinate system? The coordinates are the address for any individual point in a GIS. Typically, these are in the form of an X coordinate, or easting, which tells you how left or right a point is from a given starting point or origin, and a Y coordinate, or northing, which tells you how far up or down it is from this same point. Thus, the coordinate system provides the address for all your locations in a GIS project. The units (known as map units) for the coordinate system are usually defined by the projection it is associated with. For example, for a transverse mercator projection, the coordinates are usually given in metres, while for the geographic projection, the units are decimal degrees (representing longitude and latitude). When written down, the value for the Y axis (the northing or latitude) are usually given first, followed by the X coordinate (the easting or longitude). What is a datum? A datum can be thought of as the starting point, or anchor point, of a coordinate system. As you can imagine, if different data sets use different datums, then the same point may be plotted in different places even if they are in the same projection and coordinate system (which is not good). As a result, you need to know what datum your data set is based on in order to be able to plot it properly in a GIS project. Luckily, almost all modern coordinate systems now use the WGS84 datum. This is the one used by Global Positioning System (GPS) satellites and most remote sensing satellites. However, if you are using a GPS receiver, these can be set to different datums, so check that you know how yours is set. Similarly, older paper charts, maps and data sets may use different datums. For any one coordinate system, using the wrong datum can result in an error of up to ~1km or more. As a result, this is not so important for broad scale and coarse resolution studies but critical for local scale and fine resolution ones. What are decimal degrees? Decimal degrees are a unit of latitude and longitude. They are generally in the format 12.345678, where the figures after the decimal point represent the minutes, or minutes and seconds, of latitude or longitude as a fraction of a degree. There are 60 minutes in a degree and 60 seconds in a minute. In decimal degrees, coordinates which are north of the equator and east of the Greenwich Meridian are positive, while those which are south and west of these lines are negative. Latitude and longitude data must be converted in decimal degrees in order to be plotted in a GIS. It is important when doing this conversion that you know whether your original data are in degrees minutes and seconds (the traditional form) or degrees and decimal minutes (the standard formats for most GPS receivers). The number of decimal places in decimal degrees represents the resolution of such data. See the Useful Tools page for an excel workbook for converting latitude and longitude data into decimal degrees. What is the difference between accuracy, precision and resolution when recording geographic locations that are to be included in a GIS? When collecting data on geographic locations, such as the positions of sampling sites, records of where a species was seen or the path of a survey transect, for inclusion in a GIS, it is important record these data properly. In order to do this, you need to know the difference between accuracy, precision and resolution for such data. You can watch a brief, but informative, video that we at GIS In Ecology have put together to explain these concepts using target-shooting as an analogy by clicking here. What is the difference between the resolution and the scale of a raster data layer? In a raster data layer, the resolution represents the size of grid cells within it. A fine resolution grid will have a small grid cell size while a coarse resolution grid will have a large grid cell size. Within any particular study, you may use raster data layers with different resolutions. For example, you might use a fine resolution raster data layer to look at distribution in relation to water depth, but a coarse resolution raster data layer to look at the distribution in relation to meso-scale features, such as ocean eddies.
The scale and the resolution of raster data layer need not be related. A raster data layer can have a fine resolution but cover a large area. Similarly, a raster data layer that covers a relatively small study area can have a coarse resolution. The only limitation is that for any given scale, a finer resolution data layer contains more grid cells. This means that it will have a larger file size and may take longer to process. However, this is not necessarily a justification for using a coarser resolution for raster data layers that cover larger areas. Instead, the most appropriate resolution for a given data layer should be defined by its ecological characteristics and the requirements of your study and not by the processing time or the size of your storage disk. After all, you can always break a large raster data layer into several smaller parts so that you can use it at the required resolution if you need your data to be processed faster or use less disk space.
3. Questions About Problems With Your GIS Project/Data layers: This section is based on chapter twenty three of An Introduction To Using GIS In Marine Biology By Colin D. MacLeod. Where did all my data go? There are three common reasons why your data may suddenly disappear from a GIS project. Firstly, you may have zoomed too far in, too far out or panned away from the point in your data frame where your data are plotted. To make your data re-appear, all you need to do is to return to the previous extent of your data view. In ArcView 9.3, this is done by right-clicking on the name of the data layer in the TABLE OF CONTENTS window and selecting the ZOOM TO LAYER tool to take you back to the right place. Secondly, you may not have the right data frame active. Check whether you have the right data layer active. If not, activate the data frame which contains the data you wish to see displayed. In ArcView 9.3, this is done by right-clicking on the name of the data frame in the TABLE OF CONTENTS window and selecting ACTIVATE. Thirdly, you may simply not have have your data layer set to display. In this case you need to change the settings so that your data layer is set to display. In ArcView 9.3. this is done by clicking on the box next to the name of your data layer in the TABLE OF CONTENTS window so that there is a tick beside it.
There are three common reasons for a data layer disappearing from a GIS project after you have closed it. The first is that you have moved the source files for a data layer and the GIS software no longer knows where to find it. This is usually indicated by the software telling you that the source file is no longer active, or that it cannot find it. This can be solved by either moving the source files for the data layer back to their original locations, or adding the data layer back in to your GIS project from its new location. A variation on this is that if you have stored files for data layers on removable disks, if these disks are not attached to your computer, the GIS software will not be able to find it. Secondly, you (or someone else) may have edited a data layer you are using in your current GIS project in a different GIS project and, as a result, changed the contents of the source file. Therefore, the features or information you are looking for in your data layer may no longer be there. The only solution to this is to go back to an archived version of this data layer, make a copy of it, and load it back into your GIS project. If you have not created an archived version of your data layer, then you will need to try and find an original copy of it from somewhere else. However, any changes you have made since you last archived a copy of your data layer will be lost, so remember to archive your data layers regularly. Lastly, it is possible that the last time you worked on your project, you forgot to save it before you closed it down. Unfortunately, the only way to deal with this issue is to add the missing data layers back into your GIS project. With any luck any changes you have made on your data layer will have been saved in them. If not, you will have to repeat the work. However, think of this as a learning experience and remember to save your project regularly as you go along, and definitely before you close it. Why don’t my data layers appear where they should in my GIS project? This is one of the most common problems with GIS data projects. You may find that your data layers may plot in completely the wrong places, or be plotted much bigger, or much smaller than they should. Any such mis-placed data layers can be located by using ZOOM TO LAYER and/or ZOOM TO LAYERS tools in your GIS software. This problem is usually caused when one, or more, of your data layers have not being assigned the correct projection (or coordinate system or datum), and, as a result, it is plotting in the wrong place. Alternatively, it may be that no projection has been assigned to one, or more, of your data layers. In ArcView 9.3, this can be solved by going to the DEFINE tool, and using it to assign the correct projection/coordinate system to each data layer where there is a problem. In ArcView 9.3, you can check the projection/coordinate system that has been assigned to a specific data layer, by right-clicking on the name of the data layer in the TABLE OF CONTENTS window, selecting PROPERTIES and then clicking on the SOURCE tab. The projection/coordinate system (if one has been assigned to the data layer) will be listed in the DATA SOURCE section of the window. However, you may need to scroll down in this window to find it. If you have the wrong projection/coordinate system set for a data layer, you will need to change it to the correct one
This situation is usually caused by problems converting the coordinates for your locational data into decimal degrees. Firstly, you may have applied the wrong formula, or confused the format of your latitude and longitude data (for example, confusing data which are in degrees and decimal minutes for data which are in degrees minutes and seconds or vice versa). In this case, your points will plot close to where they should, but not in exactly the right place, with some having a greater amount of error than others. To solve this problem, examine your original data, and do the conversion properly before loading the data into your GIS project again. Secondly, when converting data to decimal degrees, you may have forgotten that latitudes south of the equator and longitudes west of the Greenwich Meridian should be negative and not positive. This can result in points which should plot in the western Atlantic plotting in central Asia, or points which should be plotting off southern Africa, being plotted in Europe and so on. To solve this problem, go back to your original table and add the negative signs for southern latitudes and western longitudes and load the data into your GIS project again. Other possible reasons for locational data not plotting in the right place may be because you have selected the wrong values for latitude and longitude. The most common error it that you have plotted latitude values as longitude and longitude values as latitude . Remember that longitude is the X coordinate and latitude is the Y coordinate, even though we usually say latitude first. Alternatively, you may have used latitude for both the X and Y coordinates, or done the same with longitude, or you have accidentally selected the wrong field as the X and/or Y variable. This problem is solved by loading the data into your GIS project again, making sure that you use the correct fields for the X and Y variables. If you have only some points which plot in the wrong place, such as in the sea off Africa when they should be in the central Pacific this is most likely because some of your location data are missing latitude and/or longitude values, these will be treated as having zero latitude and/or longitude and will be plotted in the according position. To solve this problem, remove any lines with missing latitude and/or longitude values from the table and load the data into your GIS project again. This problem can also be caused by your GIS software treating your latitude and longitude values as text rather than numbers. If this is the case, you will need to re-format these values so that your GIS software recognises them as numbers. This is most easily done using a spreadsheet programme rather than your GIS software. Why is my raster data not visible and/or plots in the wrong place in my GIS project? If you are having problems with raster data layers not plotting in the right place, this may because there has been a problem assigning the right projection/coordinate system to them. In particular, if you add a raster data layer to your GIS project and it has no projection/coordinate system assigned to it, you may find that even if you assign the correct projection/coordinate system to it that it still does not plot properly. If this is the case, try removing the data layer from the GIS project. Next, assign the correct projection/coordinate system, and then add it back into your GIS project. In ArcView 9.3, this is done using the DEFINE PROJECTION tool. My GIS software is not recognising a decimal point as a decimal point in my GIS data layers. Why is this? This is most likely caused by a conflict between your GIS software and your computer operating system in terms of the symbol it uses as a decimal separator. Specifically, if you are using a computer which is not set to use a decimal point (.) as the symbol to mark the division between whole numbers and decimal fractions (as in 12.345), this may cause problems. If you find you are having problems, you may need to change the settings on your computer to use a decimal point as the decimal separator. In Windows 7, this can be changed by going to CONTROL PANEL> CLOCK, LANGUAGE AND REGION> CHANGE THE DATE, TIME, OR NUMBER FORMAT> ADDITIONAL SETTINGS> DECIMAL SYMBOL. Why is some of the data in my data layer not visible in my GIS project? If some of the data in your data layer are visible, but other bits of it are not, the most common reason is that you have changed the legend or key for the data layer and chosen not to display some or all of your data. This can easily be sorted by changing the legend or key for you data layer again so that all your data are shown. In ArcView 9.3, this is done by right-clicking on the name of your data layer and selecting PROPERTIES. In the LAYER PROPERTIES window, select the SYMBOLOGY tab and change the settings to that all your data layers are displayed. Why can I not zoom in or out, or pan in the view window of my GIS project? The most common reason for this is that you have fixed the extent of your data frame. In order to allow you to zoom in, our, or pan again, you may need to unfix this extent. In ArcView 9.3, this is done by right-clicking on the name of your data frame and selecting PROPERTIES. Next, select the DATA FRAME tab and change the extent of the data frame from FIXED to AUTOMATIC.
The most common reason for this is that you have some of the features in your data layer selected and the tool is only using these selected features. You can avoid this problem by making sure that none of the features of your data layer are selected before you run your tool. In ArcView 9.3, this can be done by clicking on the SELECTION menu and selecting CLEAR SELECTED FEATURES. This will clear the selected features in all data layers in your GIS project. If you only want to clear the selected features of one data layer, right click on its name and select SELECTION> CLEAR SELECTED features. When I use a tool in my GIS software, it does not work properly. Why is this? The most common reason for this is that there is a conflict between the projection/coordinate system assigned to your data layer(s) and/or that used by the data frame or the GIS project itself. The easiest way to solve this sort of problem (and indeed to make sure that it does not happen in the first place) is to make sure that all your data layers and your data frame as in the same projection/coordinate system before you start using them in any of the tools in your GIS software.
4. Questions About 'GIS In Ecology' and the services we offers: I do not have any money to pay for GIS advice, but I really need your help with my work. Do you provide any advice or support for free? Unfortunately, GIS In Ecology is a commercial business that we use to generate the income to fund our own research. Therefore, while we understand that not everyone has money to pay for GIS advice and support, we cannot provide these services for free. You can try submitting a question to this FAQ page, and we may answer it in due course, but we cannot guarantee to answer it, or indeed, even respond to it. To see the rules for submitting FAQs, and for the email address to send it to, click here. Alternatively, you can try posting your question on our online forum. I need someone to sort out my GIS project because it has stopped working. Can you do this for me? If your GIS project has stopped working, there is probably little we can do to help. This is because it can be incredibly time-consuming to work out why someone else's GIS project has stopped working. You can try looking at the advice in our section about problems with GIS projects for advice which may help, but in almost all cases, you will just have to accept that your GIS project is damaged beyond repair, and you will have to build it again. However, in most cases, all your data layers will still be on your computer, so this will probably not be as onerous a task as it might at first seem. I need GIS advice very urgently as I have a deadline coming up, can you provide it? While we can provide GIS advice, we cannot guarantee to be able to provide it at short notice. This is because we may have other projects that we are currently working on, or because we are doing our own research. If you do have an urgent problem, please contact us with details of what advice you need and how soon you need it by. We will then be able to let you know whether we can provide it within the time frame you require. We have a large commercial GIS project which we need completed. Do you take on large commercial projects? In general, we only take on relatively small projects as part of our consultancy service. This is to ensure that we can offer the customers we take on as high a quality service as possible. However, we are happy to provide advice and support for larger projects, if this is appropriate. Please see our advice service page for more details. I am looking for advice about using GIS for a non-ecological project, can you provide it? Unfortunately, our area of expertise is in using GIS in ecology and marine biology. Therefore, we cannot provide advice about using GIS in non-ecological projects. I am looking for a job working with GIS in ecological research, do you have any open positions at GIS In Ecology? At the moment, we are a small business whose main aim is to provide funding for our own ecological research (see our case studies page for some examples of the research we have been involved in), and we do not plan on taking on any extra staff in the foreseeable future. If this changes, we will create a new page on our website which will advertise any positions we have open. Until this time, please do not email us looking for jobs as we do not wish to disappoint you. What are your credentials for offering advise and training about using GIS in ecological research? We have been using and teaching GIS in ecological research for over a decade. You can find out more about our experience by clicking here. In addition, you can find more information about the background of the founder of GIS In Ecology (Dr. Colin D. MacLeod) by clicking here and find a copy of his most recent CV/Resume by clicking here. Finally, you can find examples of some of the research projects we have used GIS in by going to our case studies page.
5. Other Frequently Asked Questions: At the moment, there are no other Frequently Asked Questions posted on this page.
If you would like to suggest a question for this FAQ page, please email it to FAQs@GISinEcology.com. If we think it is appropriate for this section of our website, we will add it, in due course, along with an appropriate answer. However, we will not respond directly to questions emailed to this address. Nor will we enter into any correspondence about it or any answer we provide. Similarly, we will not answer or post all questions that are submitted, and we will only do this for those which we select as being appropriate. In addition, even if your question is selected, we may not post it on this page for some time. This is because this service is offered for free and is done in our spare time. If you wish to receive a quicker response, you can try asking a question on our online forum. If you wish to receive a response to specific question, you will need to go through our Advice and Consultancy Service or our Online Support Service. This will almost certainly incur a charge. This is because we are a commercial service and because we use the income generated from it to fund our own ecological research. For more information on these services, please go to the appropriate pages on this website. |
|
|
GIS In Ecology Buttons For Your Website:
|