This is an archived version of this site. For the new active version, please click here.
|
|
|
|
What Is GIS?
This information is based on chapters one and two of An Introduction To Using GIS In Marine Biology by Colin D. MacLeod
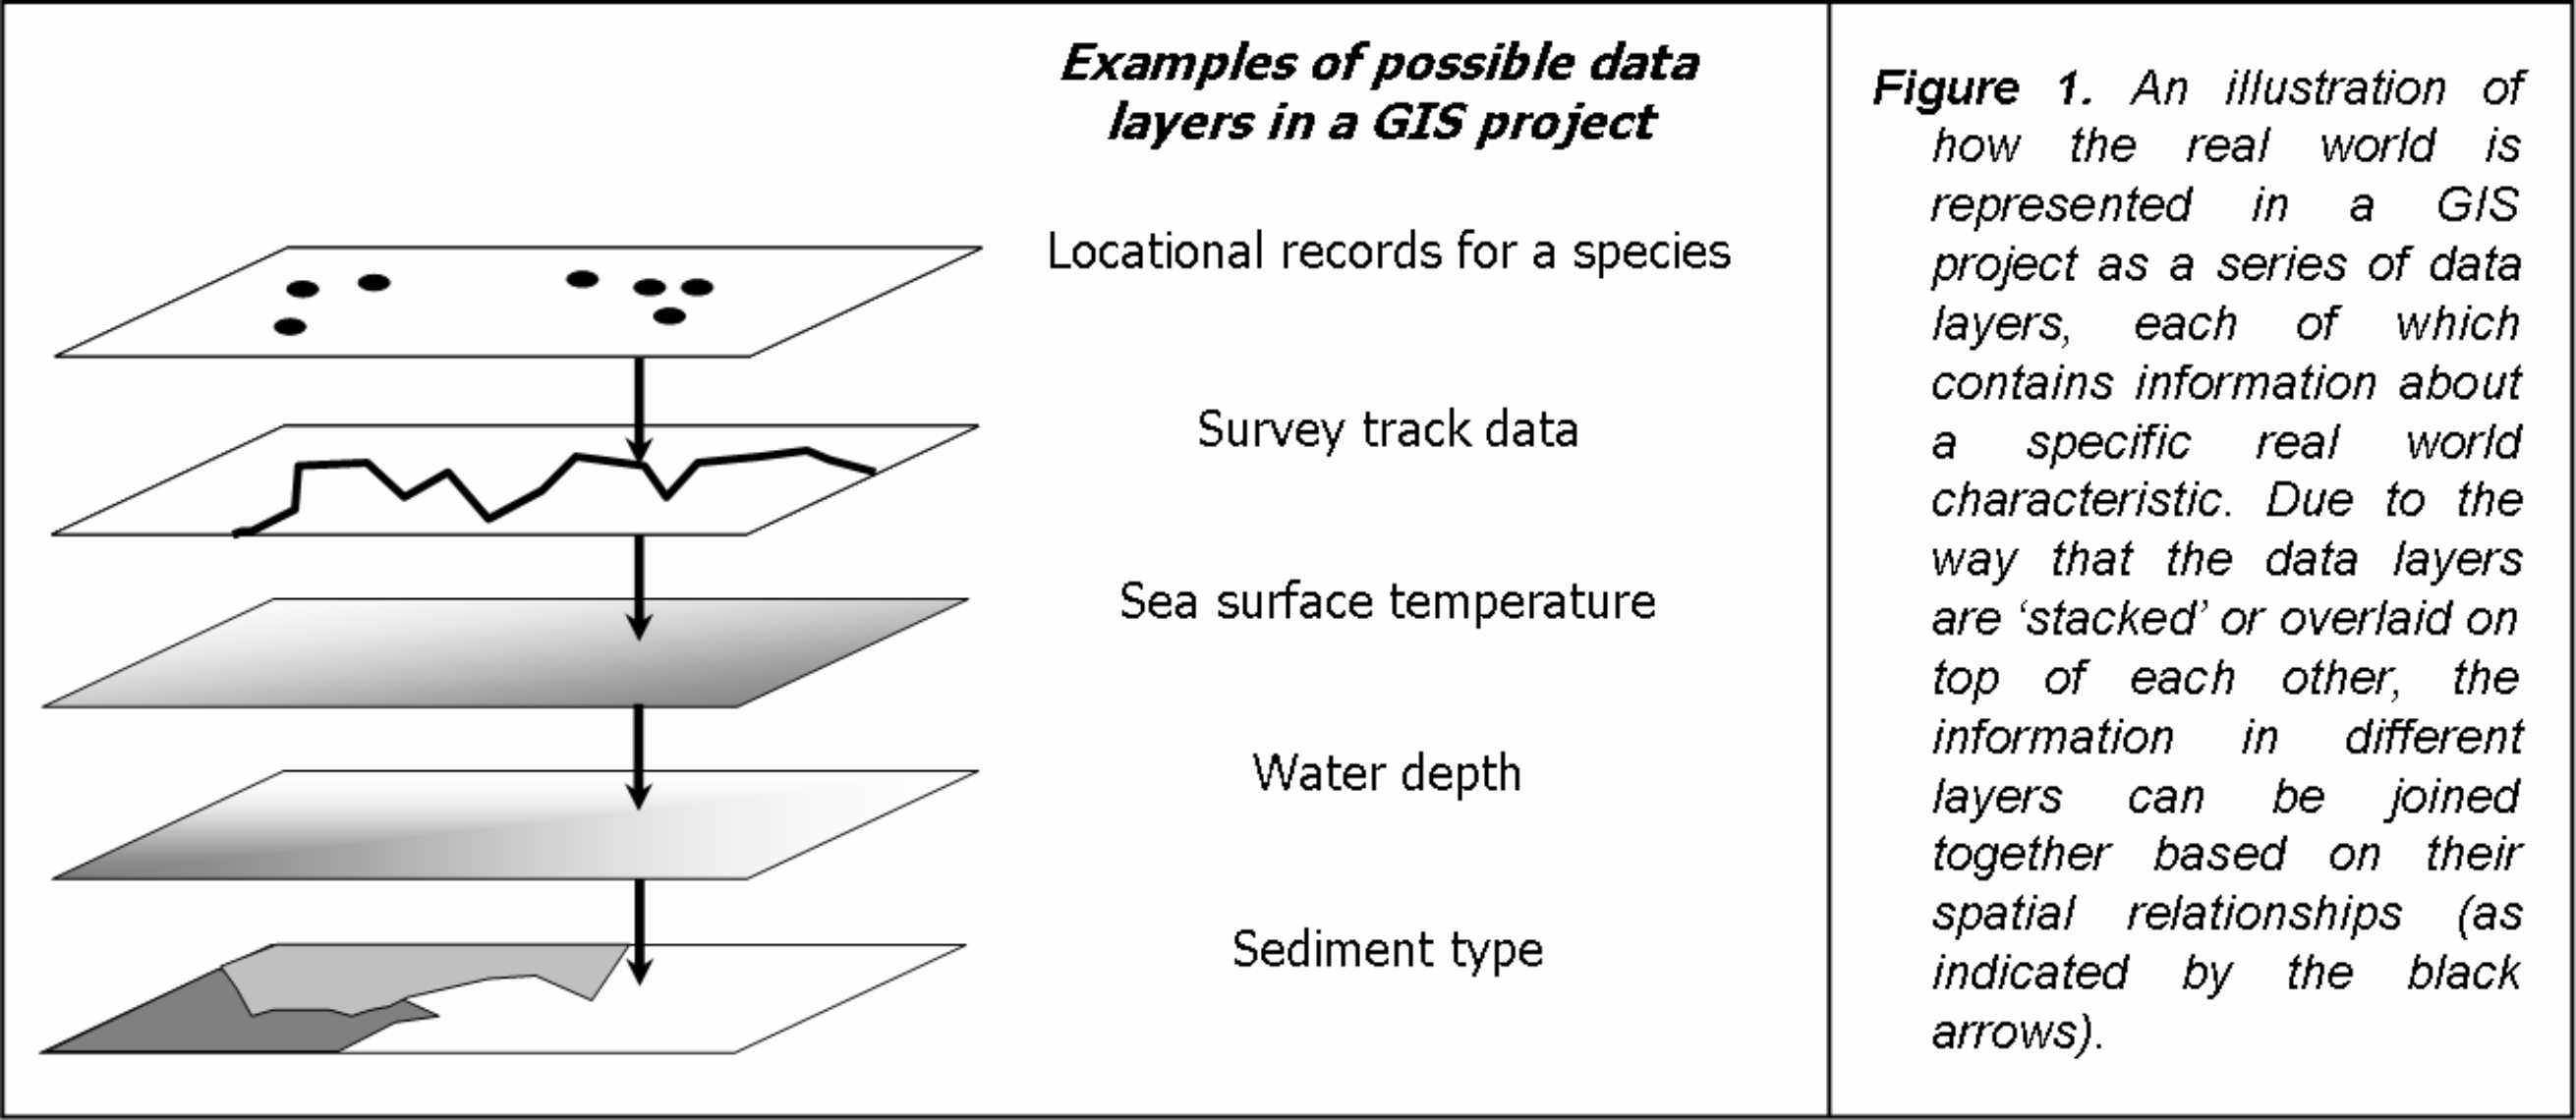
A Geographical Information System (known as a GIS for short) is a database that allows the user to explore spatial relationships within and between data sets (see figure 1). It generally consists of four basic parts. These are the data itself, the software used to explore the spatial relationships, the hardware used to run and store the software/data and the users.
For most ecological research, the only parts which you ever really need to think about are the data and the software as you are the user and you will probably be using a standard laptop or desktop computer to run your GIS software and to store your data.
Aims for GIS projects can range from being relatively simple (‘I wish to make a map showing my sampling locations in relation to water depth’) to being highly complex (‘I wish to model the influence of climate change on the distribution of my study species’).
The basic concept of GIS is very simple. Normal databases primarily consist of a series of tables which can be linked together to allow the data within them to be extracted, compared or manipulated based on values in different fields or columns in them. However, normal databases have great difficulty in manipulating data in a spatial context.
For example, while you can use a normal data base to link data on species occurrence to temperature for the month in which it was recorded (if you have such data available), it is not as easy to link it to temperature data from a similar location in space because the database cannot easily work out which temperature data point is closest to the location where a species was recorded.
It is this power to compare and manipulate data based on their spatial relationships which makes GIS such powerful tools for ecologists.
The information on spatial distribution is held in the GIS as a series of data layers (analogous to individual tables within a normal database). These data layers not only have the attributes for each record in them, but also have information which defines the areas of the Earth which they represent, and the size, shape and position of any features within it.
Based on this information, specialist GIS software can work out how features in different data layers relate to each other. For example, a GIS could be used to work out the values for different habitat or environmental variables, such as water depth, altitude or temperature, where a particular species was seen, as indicated by the arrows in figure 1.
By adding data layers that contain the specific information you are interested in, you can start investigating the spatial relationships between them. For example, if you wish to know what altitudes different species are found in, you can add one data layer which contains information on the locations where each species were recorded, and another which contains information on altitude. You can then compare the spatial relationships of these two sources of data to look at which species occur in which altitudes.
A GIS is generally created using specialist GIS software, and such software usually provides a series of tools which allow you to not only create, manipulate and edit data layers, but also to investigate the spatial relationships between them in a variety of ways. Therefore, the GIS software that you use is a key component of any GIS project. However, different GIS software may contain different tools, and some are better at some tasks than others. As a result, it is important that, where possible, you choose GIS software which is appropriate to your requirements. More information on GIS software can be found here. |
|
|
GIS In Ecology Buttons For Your Website:
|