This is an archived version of this site. For the new active version, please click here.
|
|
|
|
Why Is GIS Useful In Ecology?
This information is based on chapter one of An Introduction To Using GIS In Marine Biology by Colin D. MacLeod
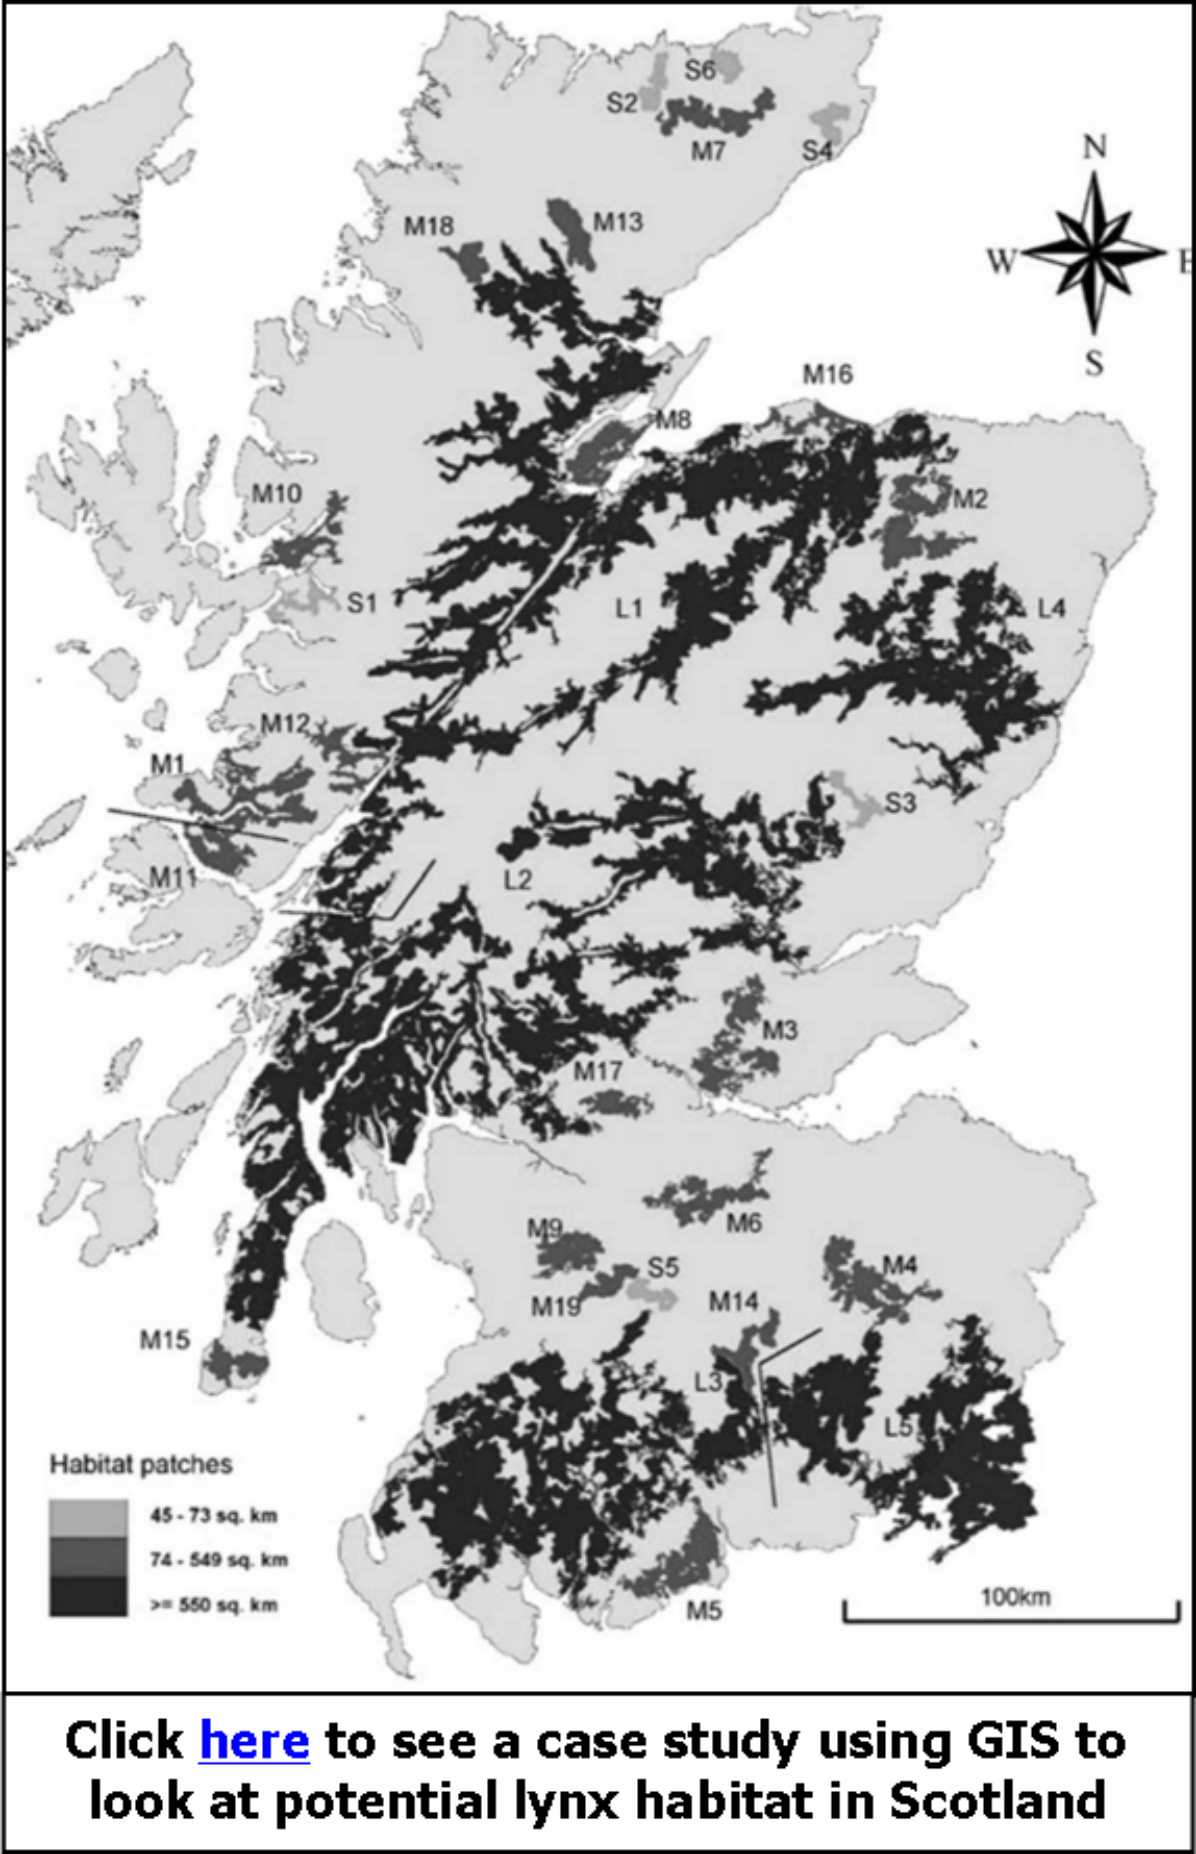
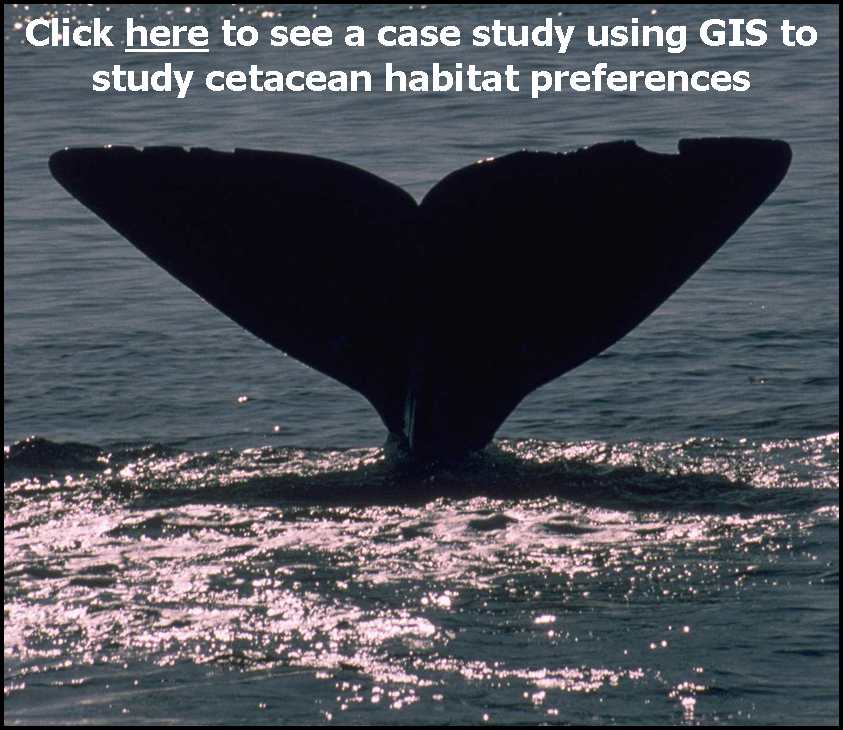
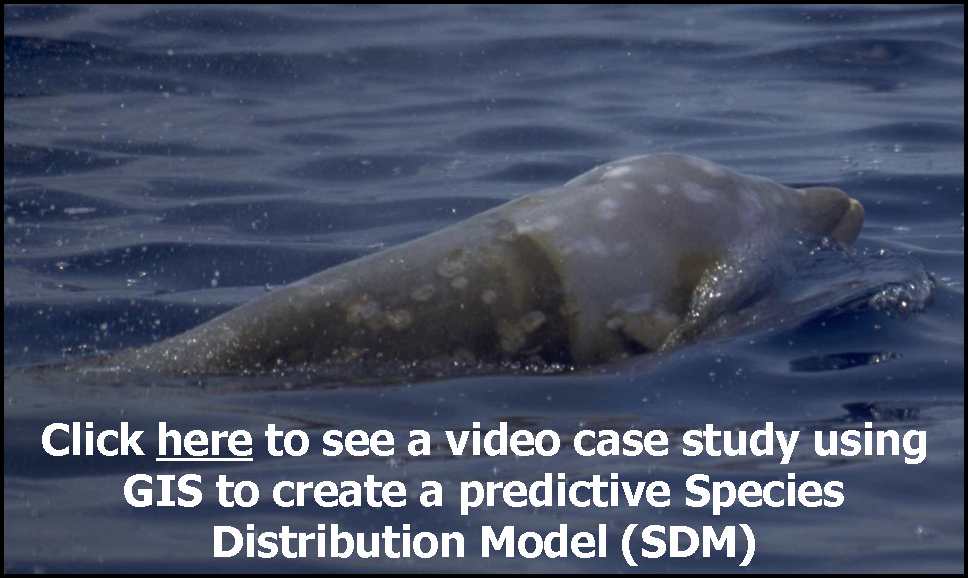
As a result, many ecological research projects would benefit from the creation of a GIS to explore spatial relationships within and between the data. In particular, while some projects can be done without using a GIS, many will be greatly enhanced by using it (click here for some examples of research projects which have used GIS).
The very act of creating a GIS will make you think about the spatial relationships within your data, and will help you formulate hypotheses to test or suggest new ones to explore. In addition, thinking about your data in a spatial manner will help you identify potential spatial issues and/or biases with your data.
For example, plotting the spatial distribution of sampling sites may help you see whether sites which are closer to each other are more similar than those which are further apart. This is something which may not be clear if you only look at your data in a simple spreadsheet or database format. If such patterns exist in your data, and are driven by factors other than those you are studying, this may mean that you have something called spatial auto-correlation which violates the assumptions of many statistical techniques. In this case, you will need to deal with this in some way or other.
GIS can also be used to make measurements and carry out calculations which would otherwise be very difficult. For example, a GIS can be used to work out how much of your study area consists of a specific habitat type, or how much of it is over 1,000m high, or has a gradient greater than 5º, and so on. Similarly, a GIS can be used to calculate the size of the home range of an individual or the total area occupied by a specific species or how long your survey tracks are, or how much survey effort was put into different parts of your study area.
In addition, you can calculate new variables within a GIS. For example, you can use a GIS to calculate slope and aspect of the local topography from elevation or altitude information. Similarly, in the marine environment you can estimate where fronts are by analysing how similar the water temperatures are at one location to those that surround it.
Finally, while GIS is mostly used for displaying and/or analysing data, a GIS can provide important information when deciding where and how to collect your data in the first place. Given that collecting ecological data is often complex and expensive, it is usually important to get your data collection right the first time. A bit of planning can go a long way to ensuring that your research is successful. There is nothing worse than spending all your time and money collecting lots of data only to find out when you come to analyse it that you are missing a vital bit of information or coverage.
For example, you may find that you have not sampled the right range of altitudes, or that you have not sampled a specific part of your study area properly, or that you missed out a location which has a specific combination of different variables (click here for a case study on using GIS to investigate survey coverage), or that your sampling locations were too close together or too far apart. While creating a GIS at the planning stage will not banish such possibilities completely, if done correctly, it will help you reduce, to a minimum, the risk of these issues cropping up at a later date. |
|
|
GIS In Ecology Buttons For Your Website:
|